Fig. 3.
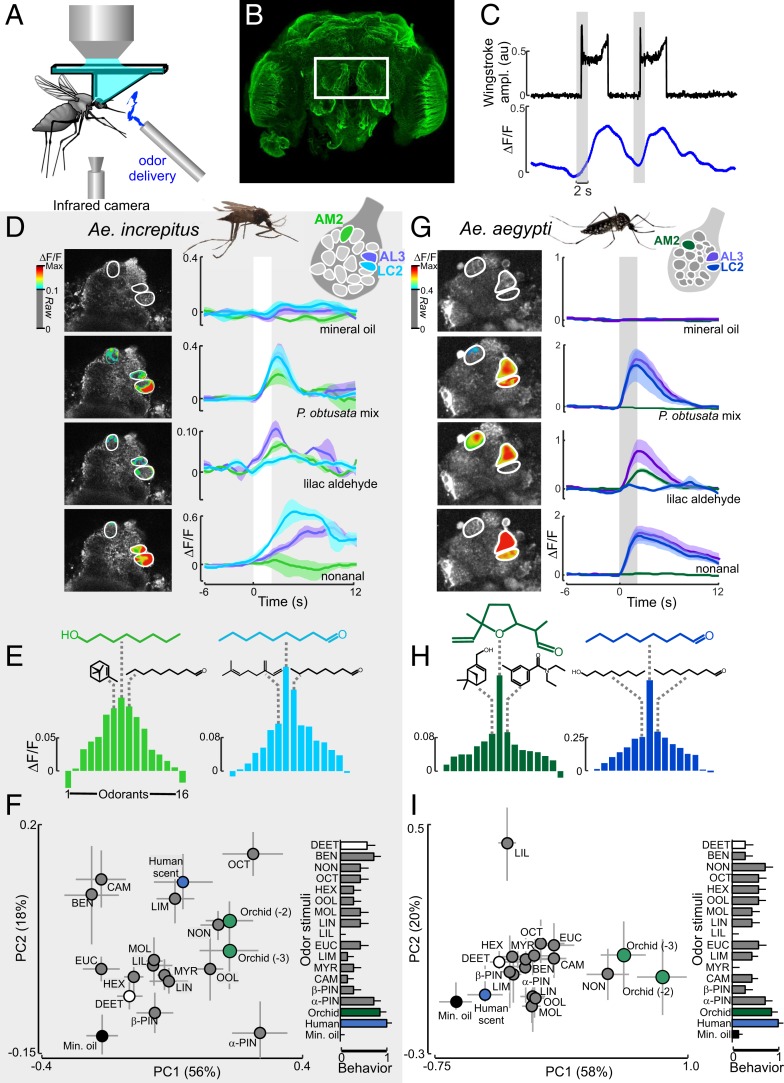
Mosquito antennal lobe responses to the P. obtusata scent. (A) Schematic of the 2-photon setup used to record calcium dynamics in the mosquito AL. (B) Ae. aegypti brain (α-tubulin stain). The white rectangle surrounds the 2 ALs that are accessible for calcium imaging. Optical sectioning using the 2-photon microscope and subsequent immunohistochemical characterization allowed us to register glomeruli to an AL atlas as well as repeatably image from the same glomeruli. Although the AL between species differed in volume (0.0029 ± 0.0001 and 0.0062 ± 0.0004 mm3 for Ae. aegypti and Ae. increpitus, respectively), they consisted of similar numbers of glomeruli (18 to 22 glomeruli) in the ventral region of the AL, ∼40 µm from the surface. (C) Representative time traces of behavioral (wing-stroke amplitude) (Top, black) and AL LC2 glomerulus response (Bottom, blue) to 2 P. obtusata odor stimulations (gray bars). (D) For Ae. increpitus mosquitoes with bath application of Fluo4, schematic of AL glomeruli imaged at the 40-µm depth (Top) and pseudocolor plot overlying the raw grayscale image (Left) and mean ∆F/F time traces (Right) for Ae. increpitus AL glomerular (AM2 [green], LC2 [blue], and AL3 [purple]) responses to mineral oil (no odor) control (Top); P. obtusata mix (Middle, Top); lilac aldehyde (Middle, Bottom); and nonanal (Bottom). White bars are the odor stimulations. Traces are the mean from 3 to 9 mosquitoes; shaded areas denote the SEM. Pseudocolor images were generated by subtracting the frame before stimulus onset from the frames during the stimulus window; only those glomerular regions of interest that were >0.1 ∆F/F are shown. (E) Response curves for the Ae. increpitus AM2 (green) and LC2 (blue) glomeruli based on a panel of 16 odorants. AM2 is most responsive to octanol (green chemical structure), followed by α-pinene and nonanal (black chemical structures). LC2 is most responsive to nonanal (blue), followed by octanal and β-myrcene (black chemical structures). Bars are the mean (n = 3 to 9). (F, Left) PC plot from responses of 20 glomeruli to the odorants. PC1 and PC2 explain 56% and 18% of the variance, respectively. The orchid mixture at 2 concentrations (1:100 and 1:1,000 dilution) and nonanal evoked stronger responses than the mineral oil (no odor) control (Kruskal–Wallis test: P < 0.05) and were significantly different in the multivariate analysis (ANOSIM: P < 0.05). Error bars represent SEM. (F, Right) Behavioral responses of the tethered mosquitoes to the odor stimuli. Responses were significantly different between the mineral oil control and the human and orchid scents (Kruskal–Wallis test: P < 0.05), although they were not significantly correlated with the glomerular representations (Spearman rank correlation: ρ = 0.35; P = 0.16). (G) As in D, but for PUb-GCaMP6s Ae. aegypti mosquitoes and the AM2 (green), LC2 (blue), and AL3 (purple) AL glomeruli. Traces are the mean (n = 7 to 14 mosquitoes); shaded area is the SEM. (H) As in E, but for the Ae. aegypti AM2 and LC2 glomeruli. AM2 is the most responsive to lilac aldehyde (green), followed by DEET and myrtenol (black chemical structures). LC2 is the most responsive to nonanal (blue), followed by octanal and octanol (black chemical structures). Bars are the mean (n = 7 to 14 mosquitoes). (I, Left) As in F, but for the Ae. aegypti mosquito and the 18 imaged glomerular responses to the panel of odorants. PC1 and PC2 explain 58% and 20% of the variance, respectively. (I, Right) Behavioral responses for the orchid and human scents were significantly different from control (P < 0.05), although the correlation with the glomerular responses was not significant (Spearman rank correlation: ρ = 0.46; P = 0.07). AM, anterior-medial; LC, lateral-central; AD, anterior-lateral.

