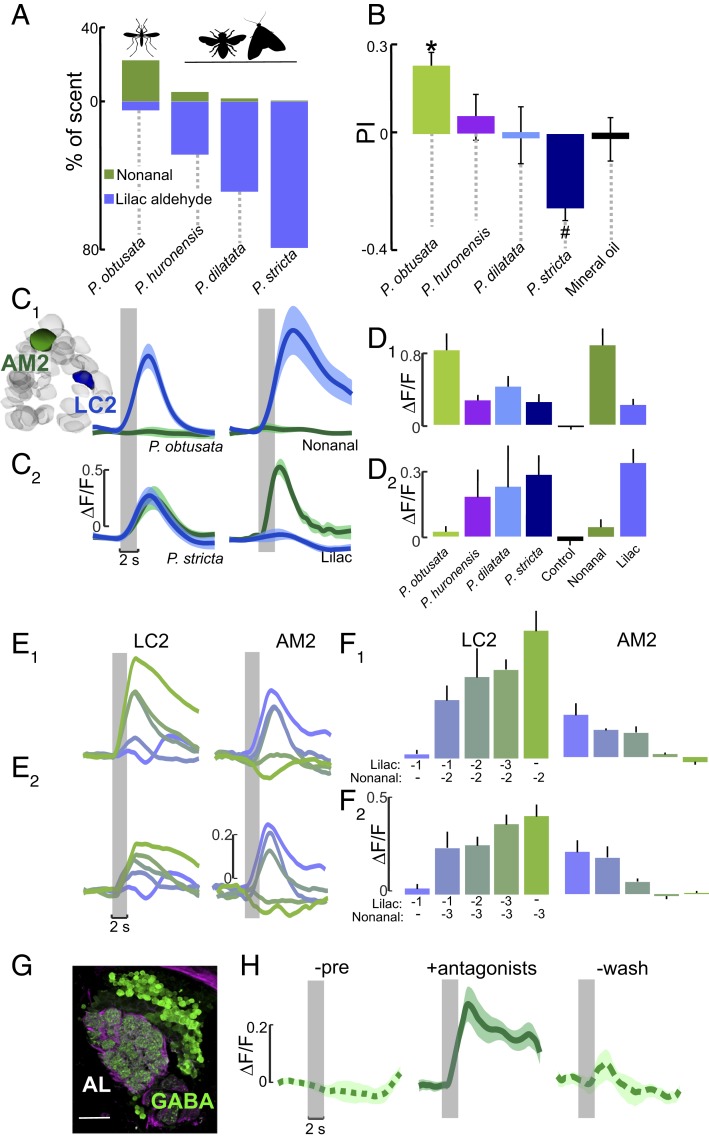
Fig. 4.
Glomeruli encoding the orchid scents are sensitive to odorant ratios. (A) Percentage of nonanal and lilac aldehyde concentrations in the different Platanthera orchid scents, which have 6- to 40-fold higher lilac aldehyde concentrations than P. obtusata. (B) Behavioral preferences by Ae. aegypti mosquitoes to scent mixtures containing lilac aldehydes at the concentrations quantified in the different Plathanthera species. Similar to Fig. 2C, mosquitoes were released in a y-olfactometer and had to choose between 2 arms carrying the scent mixture or no odorant (control). Asterisk denotes a significant difference from the mineral oil control (binomial test: P < 0.05); number symbol denotes a significant difference from the P. obtusata scent (binomial test: P < 0.05). (C and C1) Mean ∆F/F time traces for LC2 (blue) and AM2 (green) glomeruli to P. obtusata (Left) and nonanal (Right). (C2) Same as in C1, except to the P. stricta scent (Left) and lilac aldehyde (Right). The P. obtusata and P. stricta mixtures contain the same concentration of nonanal and other constituents but differ in their lilac aldehyde concentrations (see A). Traces are the mean (n = 6 to 10 mosquitoes); shaded areas denote ± SEM. (D and D1) Responses of the LC2 glomerulus to the different Platanthera orchid mixtures, and the single odorants nonanal and lilac aldehyde. The increasing concentration of lilac aldehyde in the other orchid mixtures caused a significant suppression of LC2 response to the nonanal in the scents (Kruskal–Wallis test: P < 0.05), even though nonanal was at the same concentration as in the P. obtusata mixture. (D2) Responses of the AM2 glomerulus to the different Platanthera orchid scents and nonanal and lilac aldehyde constituents. The increasing concentration of lilac aldehyde in the other orchid scents caused a significant increase in AM2 responses compared with responses to P. obtusata (Kruskal–Wallis test: P < 0.05). Bars are the mean ± SEM. (E) ∆F/F time traces for the LC2 (Left) and AM2 (Right) glomeruli. The preparation was simultaneously stimulated using separate vials of lilac aldehyde and nonanal at different concentrations to create 10 different mixture ratios. (E1) Each trace is a different ratio of lilac aldehyde to nonanal, ranging from green (10−2 nonanal: 0 lilac aldehyde) to purple (0 nonanal: 10−1 lilac aldehyde); 10−3 to 10−1 lilac aldehyde, and 10−2 nonanal concentrations were tested. (E2) As in E1, except tested concentrations were 10−3 to 10−1 for lilac aldehyde, and 10−3 for nonanal. (F and F1) Mean ∆F/F during 2 s of odor presentation for the LC2 glomerulus (Left) and the AM2 glomerulus (Right). Bars are color coded according to the ratio of lilac aldehyde to nonanal traces in E1. (F2) As in F1, except the concentrations of lilac aldehyde and nonanal in the ratio mixtures correspond to those in E2. Bars are the mean (n = 6) ± SEM. (G) Antibody labeling against GABA (green) in the right Ae. aegypti AL; background label (α-tubulin) is purple. (Scale bar, 20 µm.) (H) Mean ∆F/F time traces for the AM2 glomerulus. GABA receptor antagonists block the suppressive effect of nonanal to AM2’s response to the lilac aldehyde in the P. obtusata mixture, causing a significantly higher response than the preapplication and wash periods (Kruskal–Wallis test: P < 0.05). Traces are the mean (n = 4 mosquitoes) ± SEM.

