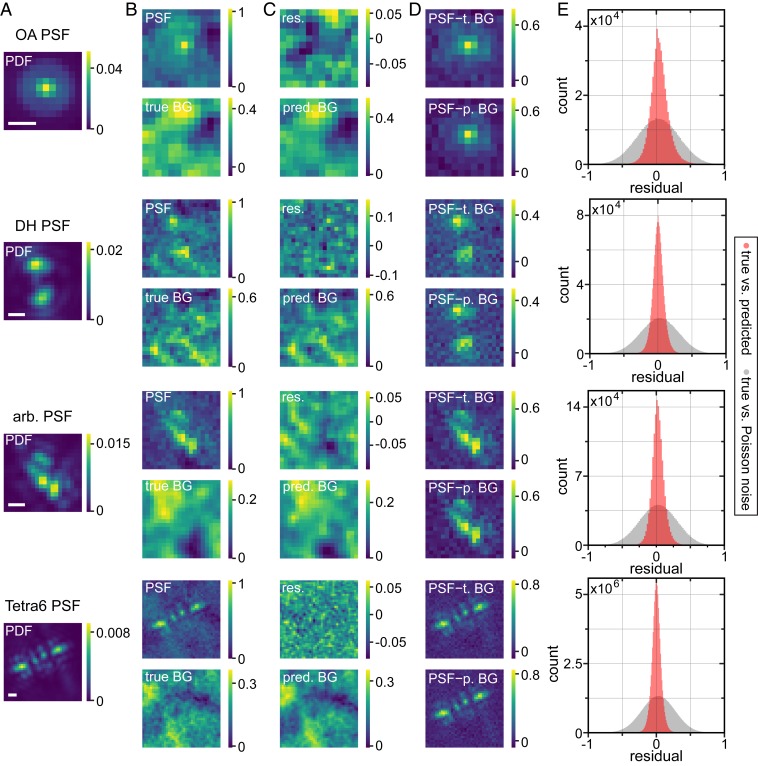
Fig. 2.
Representative examples for BG estimation with BGnet and overall performance. (A) Example PDFs for the 4 investigated PSFs. (B) The BG-corrupted input PSFs, normalized between 0 and 1, and the underlying (true) BGs. The signal photon count for the depicted PSFs is 4,723, 5,275, 5,994, and 37,637, and the average BG photon count per pixel is 147, 137, 26, and 127 (from top to bottom). (C) The BG prediction by BGnet on the same intensity scale as the input PSF and the residual (res.) between true and predicted (pred.) BG. (D) The original PSFs corrected for BG using either the true BG (t. BG) or the predicted BG (p. BG). Note that negative pixel values for the BG-corrected PSFs are only a side effect of PSF normalization and originate from Poisson noise fluctuations. (E) Pixelwise residuals for all of the PSFs of the validation dataset. For this analysis, true and predicted BGs were scaled between 0 and 1, such that all residuals ranged from −1 to 1. As a control, we also calculated pixelwise residuals between the true BG and pure Poisson noise, exhibiting the same average photon count per pixel as the true BG, which was also scaled between 0 and 1 for residual calculation. (Scale bar in A, 500 nm.)

