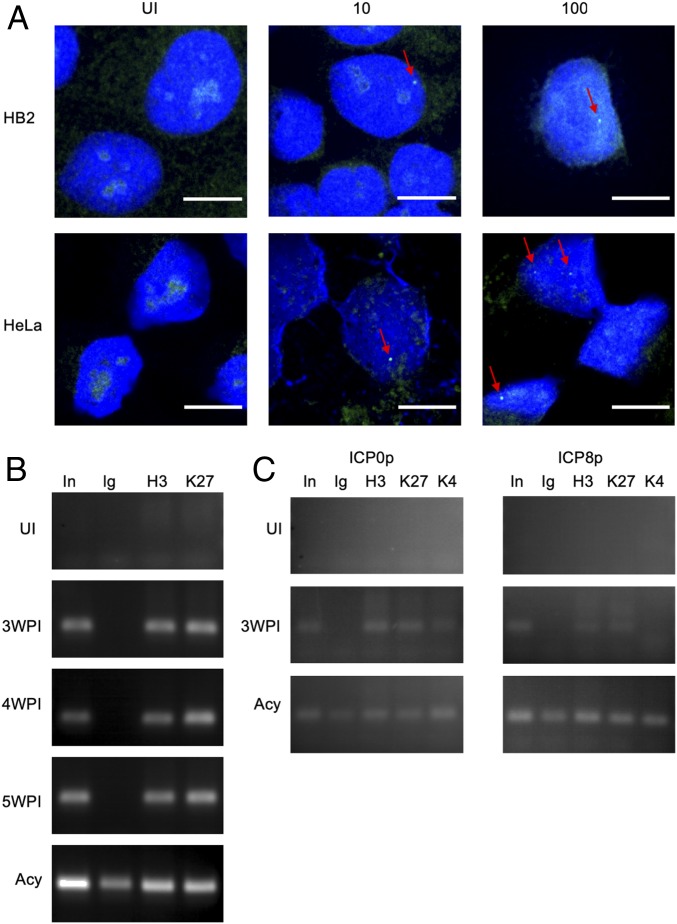
Fig. 4.
Quiescent viral genomes detected in recovered cell population. (A) FISH images of uninfected (UI) HB2 or HeLa cells and cells infected at MOI 10 or 100 recovered 4 wpi (HeLa) or 3 wpi (HB2). Red arrows indicate green fluorescent foci. Viral DNA is labeled with green probes, and DAPI is presented in blue. (Scale bar, 10 µm.) (B) Chromatin immunoprecipitation (ChIP) for UI cells, recovered HeLa cell populations (originally infected at MOI 100) at different time points postinfection as marked, and cells infected for 48 hpi in the presence of Acyclovir (Acy). PCR results of UL3 gene from Input (In) and pulldown samples with nonspecific IgG (Ig), Histone H3 antibody (H3), and Histone H3 tri methyl K27 (K27) are presented. (C) ChIP for UI cells, recovered HB2 cell populations (originally infected at MOI 100), and cells infected for 48 hpi in the presence of Acy. PCR results for promoter regions of ICP0 and ICP8 genes from In and pulldown samples with Ig, Histone H3, K27, and Histone H3 tri methyl K4 (K4) are presented.

