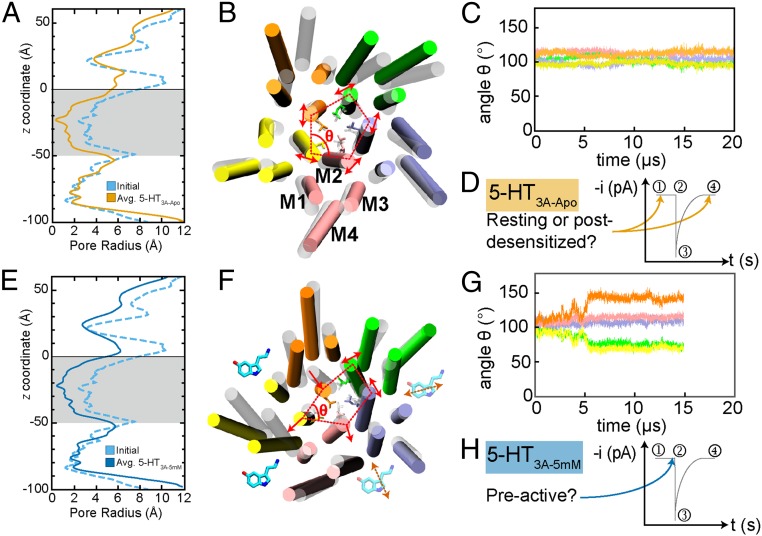
Fig. 2.
(A) Pore radius profiles for the starting structure (light blue, dashed) and 5-HT3A-Apo (orange) averaged over 20 μs with the transmembrane domain (TMD) shaded gray and error bars smaller than the thickness of the profile trend. (B) TMD snapshot for 5-HT3A-Apo (including L260) shown as secondary structure and lines (respectively), with the initial structure as transparent white and the final structure colored by monomer (A, green; B, purple; C, pink; D, yellow; E, orange), with lipids, water, and ions removed for clarity. Representative helix labels for M1–M4 shown for monomer C with red, dashed lines connecting the centers of pore-lining M2 helix to demonstrate symmetry, and red, solid arrows indicating the principal direction of M2 fluctuation. (C) Interior angle θ for the 5 monomers in A vs. time. (D) Representative trend of current (i, picoamperes) vs. time (t, seconds) for the life cycle of a 5-HT3A receptor with instantaneous currents shown for the resting (1), preactive (2), activated/open (3), and desensitized (4) states. The arrows indicate the possible states suggested by 5-HT3A-Apo. (E) Pore radius profiles for the starting structure and 5-HT3A-5mM (blue) averaged over 15 μs with the TMD shaded in gray and error bars smaller than the thickness of the profile trend. (F) TMD snapshot of 5-HT3A-5mM depicted the same as C with cartoon 5-HT indicating 5-HT binding between monomers for the entire 15 μs (solid) and transient binding (transparent with dashed arrows). (G) Same as for C, but for 5-HT3A-5mM. (H) Same as for D, but for 5-HT3A-5mM.

