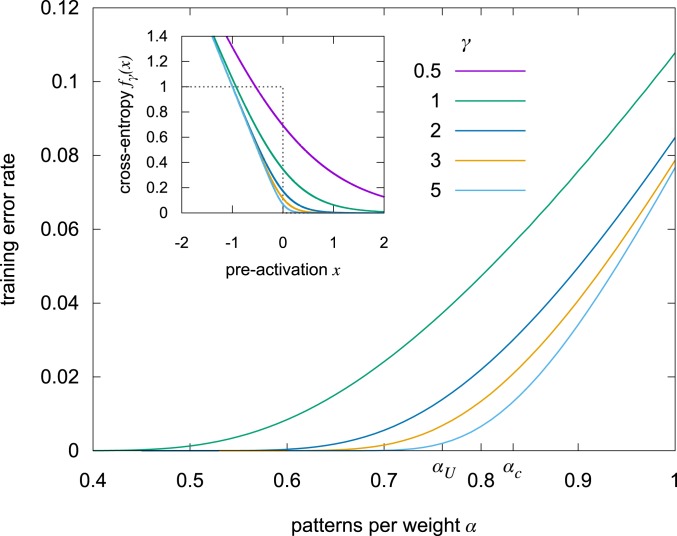
Fig. 2.
Mean error rate achieved when optimizing the CE loss in the binary single-layer network, as predicted by the replica analysis, at various values of (increasing from top to bottom). The figure also shows the points (up to which solutions exist) and (up to which nonisolated solutions exist). (Inset) Binary CE function for various values of (increasing from top to bottom). For low values of , the loss is nonzero even for small positive values of the input, and thus the minimization procedure tends to favor more robust solutions. For large values of the function tends to . The dotted line shows the corresponding NE function, which is just 1 in case of an error and 0 otherwise (cf. Eq. 1).

