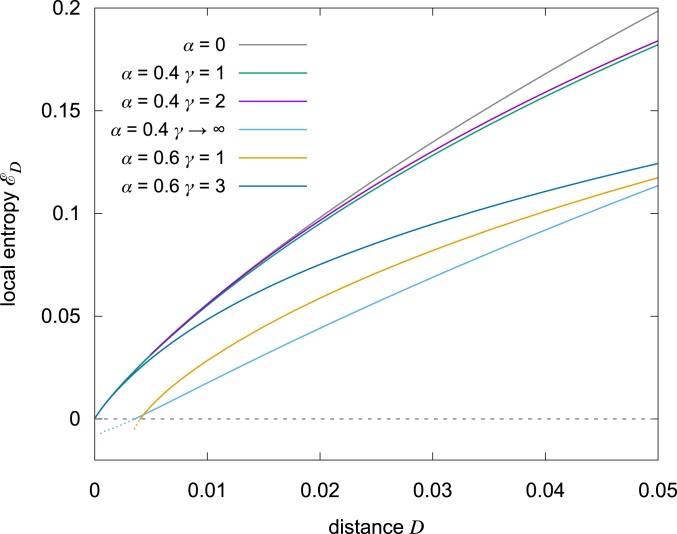
Fig. 3.
Average local entropy around a typical minimum of the loss for various values of and . The gray upper curve, corresponding to , is an upper bound since in that case all configurations are solutions. For , the 2 curves with and 2 nearly saturate the upper bound at small distances, revealing the presence of dense regions of solutions (HLE regions). There is a slight improvement for , but the curve at shows that the improvement cannot be monotonic: In that limit, the measure is dominated by isolated solutions. This is reflected by the gap at small in which the entropy becomes negative, signifying the absence of solutions in that range. For we see that the curves are lower, as expected. We also see that for there is a gap at small , and that we need to get to in order to find HLE regions.

