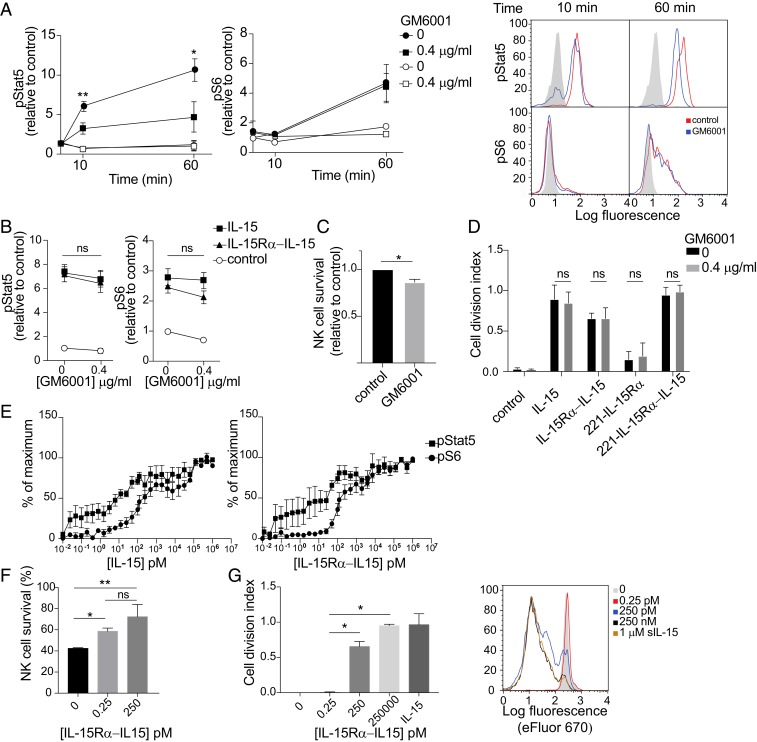
Fig. 5.
Soluble IL-15Rα–IL-15 complex generated by shedding during trans-presentation contributes to phosphorylation of Stat5, but not of S6. (A) 221–IL-15Rα cells preloaded (filled symbols) or not (open symbols) with IL-15 were preincubated with 0.4 μg/mL GM6001 for 10 min and then conjugated with primary human NK cells for 10 min and 60 min in the same concentration of GM6001. Cells were fixed at the indicated time points, permeabilized, and stained with antibodies to phosphorylated Stat5 (pStat5) and phosphorylated S6 (pS6) by flow cytometry. Graphs show mean fluorescence values relative to untreated NK cells of 3 independent experiments. Bars represent the SD of the mean. Representative flow histograms are shown on the right. Shaded histograms represent the staining at time 0. (B) Primary human NK cells were incubated with 0.4 μg/mL GM6001 and 100 nM soluble IL-15 or soluble IL-15Rα–IL-15 complex for 1 h. Cells were fixed, permeabilized, and stained with antibodies to pStat5 and pS6 and then analyzed by flow cytometry. Graphs show mean fluorescence values relative to untreated NK cells of 3 independent experiments. Bars represent the SD of the mean. ns, not significant. (C) Primary human NK cells were mixed with 221–IL-15Rα cells preloaded with IL-15 in the presence or absence of GM6001. The fraction of NK cells that remained alive after 5 d was counted and expressed relative to control GM6001-untreated cells. (D) Primary human NK cells were loaded with eFluor 670 and stimulated with soluble IL-15, soluble IL-15Rα–IL-15 complex, or 221–IL-15Rα cells, loaded or not with IL-15, in the presence of GM6001 for 5 d. Cell division of CD56+ cells was !evaluated by flow cytometry, and the cell division index (i.e., average number of cell divisions undergone by a cell in the original population) was calculated. The histograms show the mean ± SD of 3 independent experiments. A representative experiment is shown on the right. Black and shaded histograms represent eFluor signals for unstimulated NK cells in the presence or absence of GM6001. (E) Primary human NK cells were stimulated with soluble IL-15 (Left) or soluble IL-15Rα–IL-15 complex (Right) at the indicated concentrations for 1 h. Cells were fixed, permeabilized, stained with antibodies to pStat5 and pS6, and analyzed by flow cytometry. Graphs represent the mean and SEM of 6 different donors. Values are relative to a maximum, defined as a pStat5 or pS6 signal obtained after incubation with 1 μM of either soluble IL-15 or soluble IL-15Rα–IL-15 complex for 60 min. (F) Primary human NK cells were stimulated with soluble IL-15Rα–IL-15 complex at the indicated concentrations for 5 d. The fraction of NK cells that remained alive was counted after 5 d. (G) Primary human NK cells were loaded with eFluor 670 and stimulated with soluble IL-15Rα–IL-15 complex at the indicated concentrations for 5 d. Cell division of CD56+ cells was evaluated by flow cytometry, and the cell division index was calculated. 1 μM soluble IL-15 (sIL-15) added to the NK cells served as a control of maximum NK proliferation. A representative experiment is shown at the right. Statistical analysis was performed using a 2-tailed t test. *P < 0.05; **P < 0.01.

