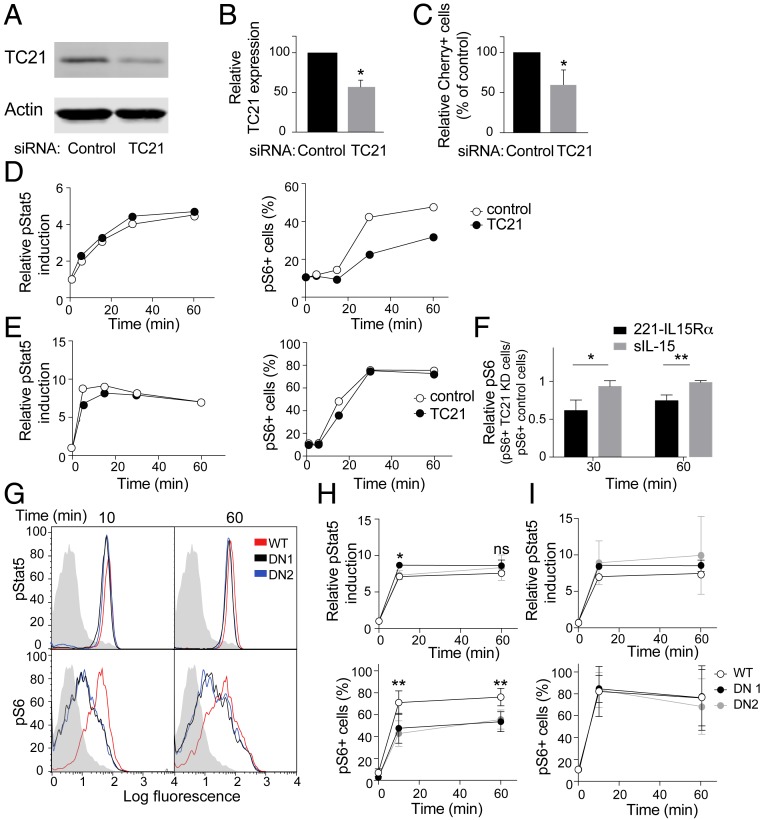
Fig. 7.
Regulation of IL-15Rα–IL-15 trans-endocytosis and S6 phosphorylation by the small GTPase TC21. (A) Immunoblots of TC21 and actin from lysates of IL-2–activated human NK cells transfected with control siRNA or a pool of siRNA to TC21. (B) TC21 silencing determined by immunoblotting in 3 different experiments, relative to the siRNA control. The quantitation was relative to actin. The graph represents mean ± SD. (C) TC21-silenced and control primary IL-2–activated NK cells were conjugated for 60 min with 221–IL-15Rα-Cherry cells that had been preloaded with IL-15. The percentage of Cherry+ TC21-silenced NK cells was determined by flow cytometry, gating on CD56+ cells, and is shown as relative to the percentage of Cherry+ siRNA control-transfected NK cells. The graph shows the mean and SEM of 3 independent experiments. (D) TC21-silenced and siRNA control-transfected NK cells were incubated for the indicated times with 221–IL-15Rα cells that had been preloaded with IL-15. Phosphorylation of Stat5, as relative to time 0, and S6, as a percentage of positive cells (mean fluorescence intensity >101), was measured by flow cytometry. A representative experiment is shown. (E) TC21-silenced and siRNA control-transfected NK cells were incubated with 100 nM soluble IL-15 for the indicated times and analyzed as in D. A representative experiment is shown. (F) pS6 relative phosphorylation in siRNA control-transfected and TC21-silenced NK cells at 30 and 60 min in cells conjugated with 221−IL-15Rα or stimulated with soluble IL-15. The graph shows the mean and SD of 3 independent experiments. (G) NKL cells stably expressing either TC21 wild-type (WT) or DN (clones DN1 and DN2) were incubated for the indicated times with 221–IL-15Rα cells that had been preloaded with IL-15. Phosphorylation of Stat5 and S6 was measured by flow cytometry. A representative experiment is shown. Shaded histograms represent the staining of pStat5 or pS6 at 0 min. (H) Quantitation of 3 independent experiments. Phosphorylation of Stat5, as relative to time 0, and S6, as a percentage of positive cells, is represented. Graphs show mean ± SD values. (I) Graphs showing phosphorylation of Stat5 and S6 in response to soluble IL-15 in NKL cells expressing TC21 WT or DN constructs (mean ± SD). Statistical analysis was performed using a 2-tailed t test (B, C, and F) or 2-way analysis of variance (H and I). *P < 0.05; **P < 0.01.

