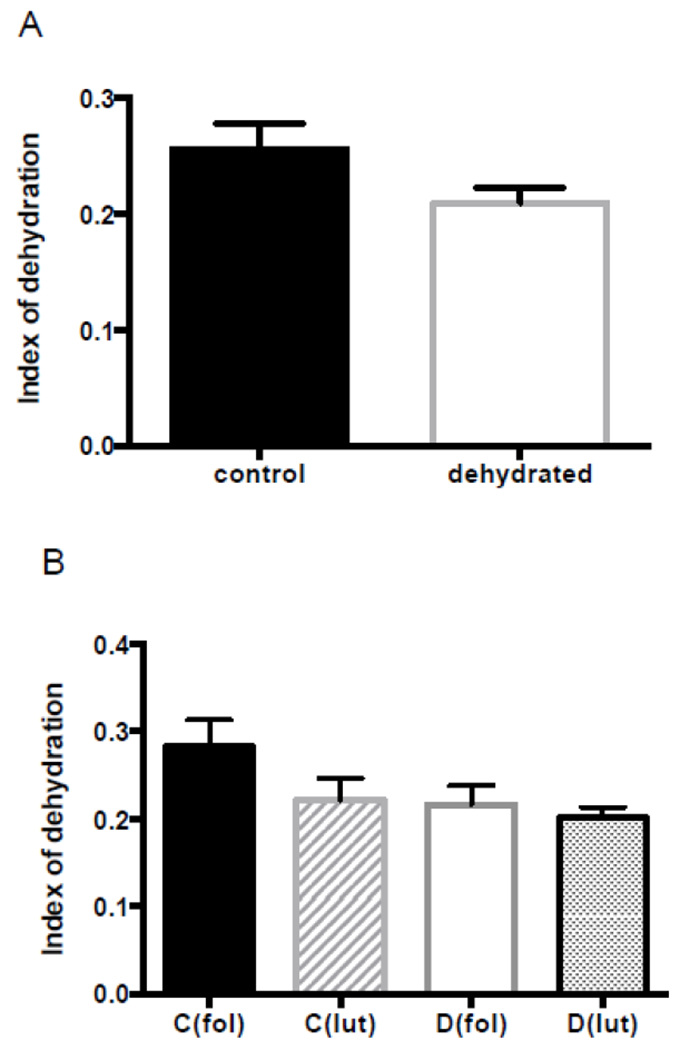
Figure 3. Index of dehydration (relative collagen distribution).

(A) Control versus dehydrated group (72h water withholding). (B) Control and dehydrated groups divided into follicular and luteal phase groups. Comparisons were performed as follows: C(fol) vs. C(lut), D(fol) vs. D(lut), C(fol) vs. D(fol), and C(lut) vs. D(lut). No significant differences were observed. Graphics show mean with SEM.
Abbreviations: C, control group; D, dehydrated group; fol, follicular phase; and lut, luteal phase.
