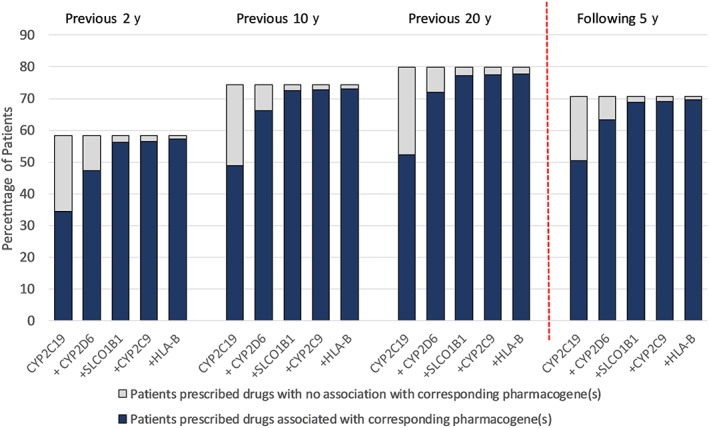
Figure 5.

Cumulative impact of testing the 5 pharmacogenes associated with the most prescriptions over available prescribing periods. The overall height of the bars shows the percentage of patients in each prescribing period exposed to drugs affected by any pharmacogene. Blue bars show the cumulative effect of adding the 5 most common pharmacogenes successively from left to right. Grey bars indicate the proportion of patients prescribed drugs associated with pharmacogenes not yet considered (when moving left to right on the x‐axis). For each period, the first blue bar represents the % of patients prescribed any drug influenced by CYP2C19 only. The second blue bar is then % of patients with any drug that corresponds to CYP2C19 or CYP2D6 or both (and so on)
