Figure 3.

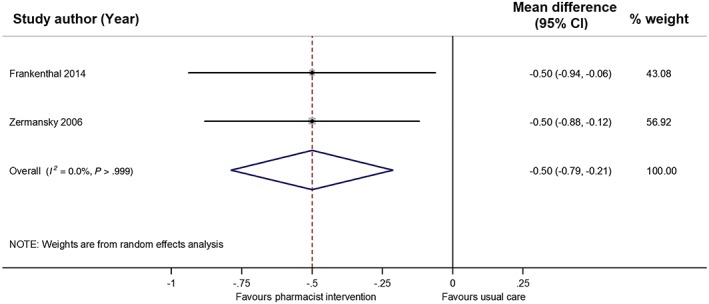
Forest plot showing the mean number of falls among residents following pharmacist intervention compared to usual care. The size of the data markers is determined by weight from random‐effects analysis. CI, confidence interval

Forest plot showing the mean number of falls among residents following pharmacist intervention compared to usual care. The size of the data markers is determined by weight from random‐effects analysis. CI, confidence interval