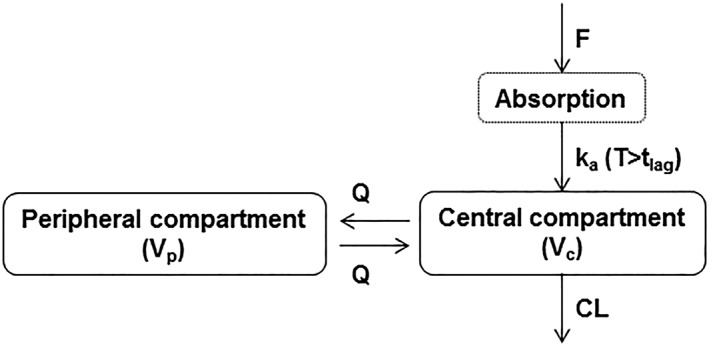
Figure 3.

Schematic diagram of fremanezumab population pharmacokinetic model structure. CL, clearance; F, relative bioavailability; ka, first‐order absorption rate constant; Q, intercompartmental clearance; T, time; tlag, absorption lag time; Vc, central volume of distribution; Vp, peripheral volume of distribution
