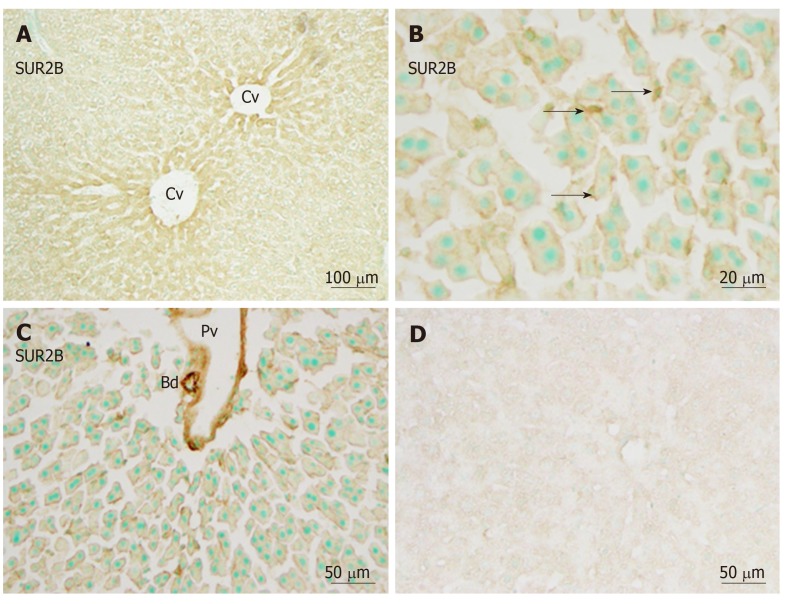
Figure 6.
Immunoreactivity with SUR2B. A: Immunoreactivity with SUR2B was stronger in the area of the central vein (Cv) vs the border areas; B: Immunoreactivity with SUR2B was expressed in hepatocytes and sinusoidal cells (arrows) of the liver. Weaker immunoreactivity in the cell membrane and medium immunoreactivity in sinusoidal cells was observed (arrows); C: Immunoreactivity with SUR2B was also observed in the endothelial cells of blood vessels and bile ducts; D: Absorption negative control section devoid of staining (no more than background was observed). Bd: Bile duct; Cv: Central vein; Pv: Portal vein. Bars: 100 µm (A), 20 µm (B), 50 µm (C and D).

