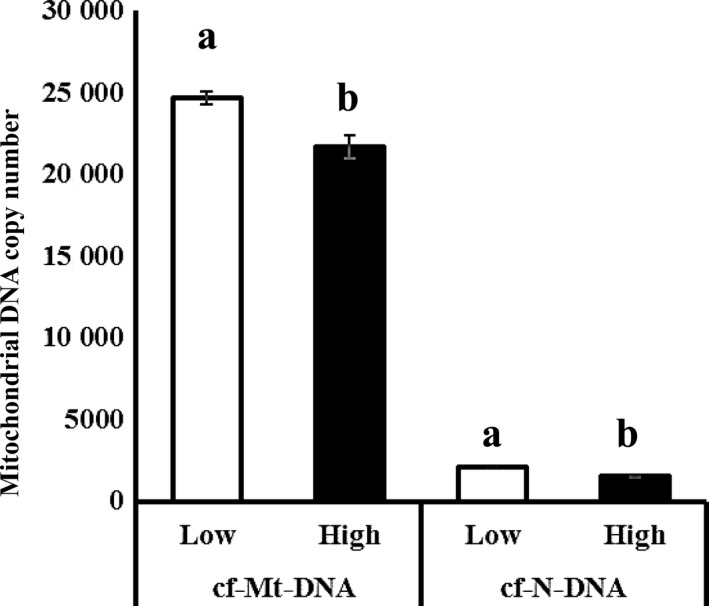
Figure 4.

Comparison of copy number of cell‐free nuclear (cf‐N‐) and cell‐free mitochondrial (cf‐Mt‐) DNA between Low‐FF and High‐FF. Follicular fluid (FF) was collected from 40 gilts that were rated based on developmental ability of enclosed oocytes. The FF was rated based on the developmental rate to the blastocyst stage of enclosed oocytes. Cell‐free nucleic DNA (cf‐N‐DNA) and mitochondrial DNA (cf‐Mt‐DNA) between the High‐FF (N. 4) and Low‐FFs (N. 4); a‐b, P < .05. Bar represents SEM
