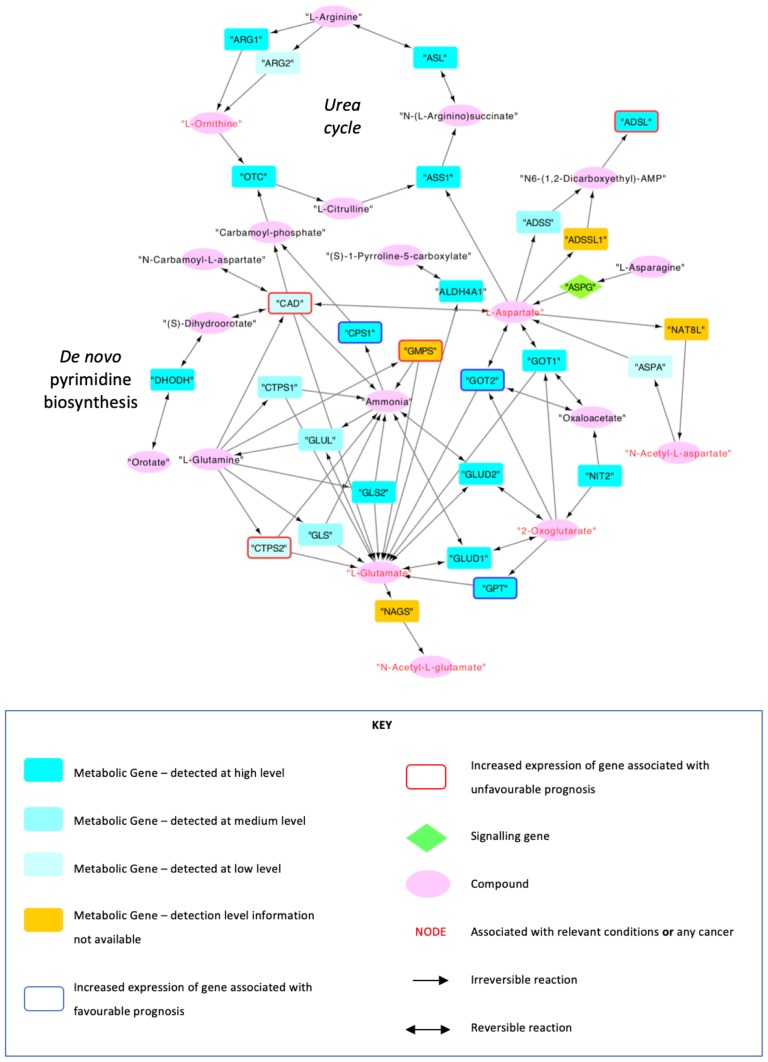
Figure 4.
Network that was formed using data from KEGG, HPA and HMDB. The nodes were filtered to be at a maximum distance of 3 steps from CPS1 and CAD, to show metabolites that are expressed in hepatocytes, and to genes that are connected to at least two metabolites. Data from TCGA and HPA were used to indicate whether any nodes were associated with any relevant conditions and cancers. The genes that were associated with favourable and unfavourable prognoses upon upregulation at an RNA level were also labelled using data from TCGA and HPA.

