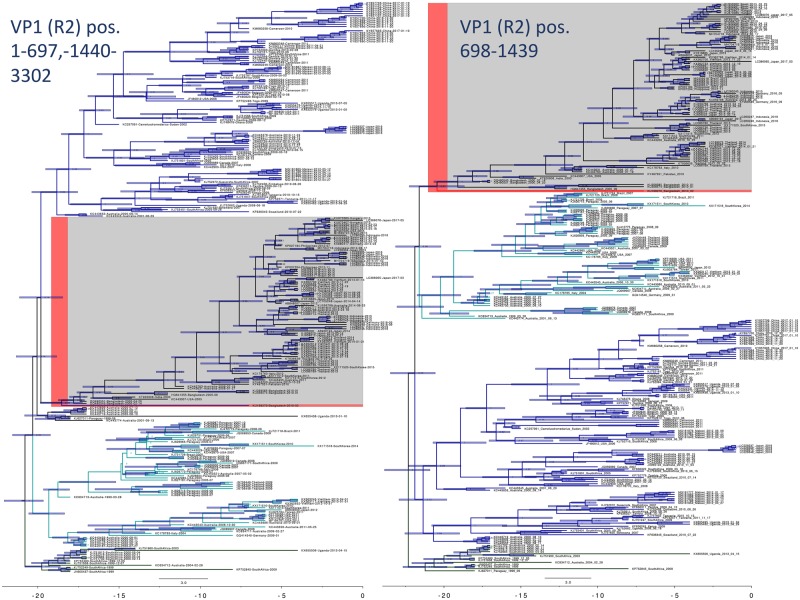
Figure 2.
Bayesian phylogenetic analysis of a possible recombination event in VP1 that became fixed in the population. The strain closest to the recombination event is highlighted in red. Major clades are colored to show the phylogenetic incongruity. Nodes are labeled with posterior probabilities with 95 per cent node height intervals shown. Time axis at the bottom is in years before 2017.

