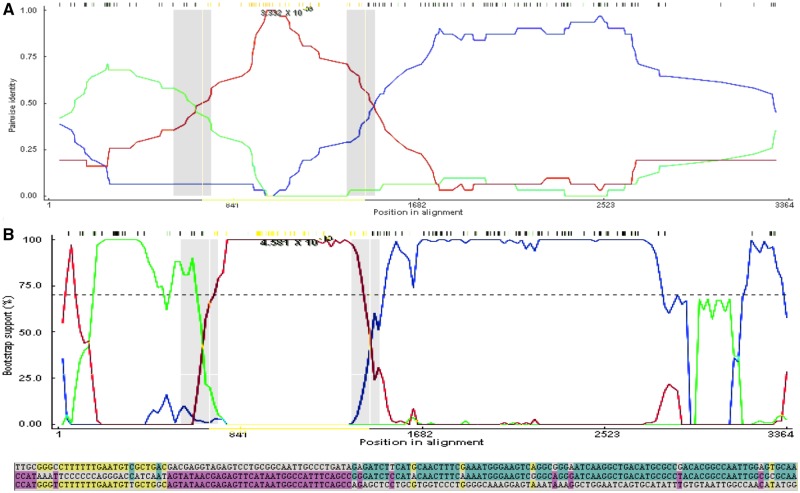
Figure 3.
(A) An RDP analysis (top) and a BootScan analysis (bottom) showing a putative recombination event between two R2 segment 1 genotypes. The red line compares the minor parent to the recombinant, blue line compares the major parent to the recombinant, and the green line compares the major parent to the minor parent. The Y-axis for RDP (top) is the pairwise identity, while the Y-axis for BootScan (bottom) is the bootstrap support. The X-axis is the sequence along segment 1. (B) The relevant sites shown above color coded to strain that the recombinant matches. The recombinant is the middle sequence, the minor parent is the bottom sequence, and the major parent is the top sequence. Mutations matching the major sequence are shown in blue, while mutations matching the minor parent are shown in purple. Yellow mutations show mutations not present in the recombinant sequence but which match the major and minor parents, possibly suggesting a second recombination event.

