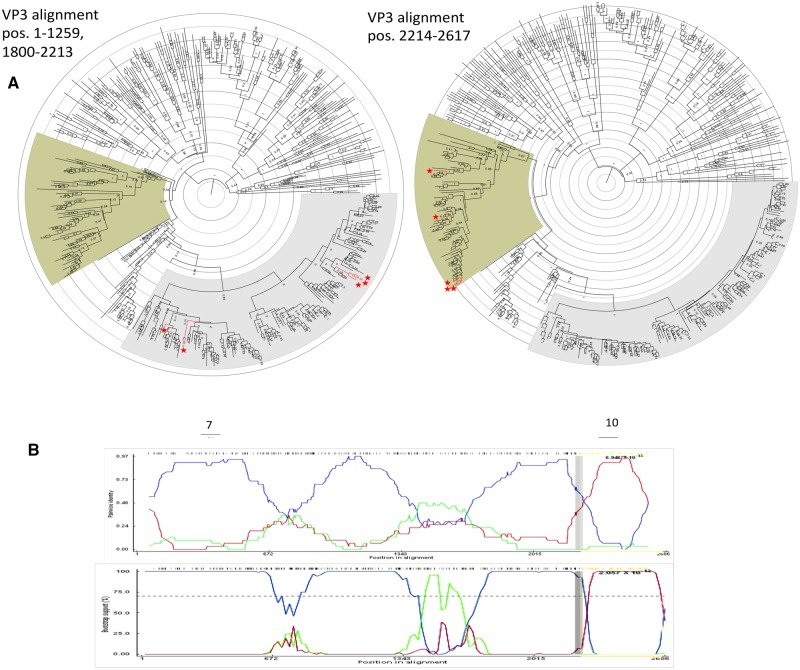
Figure 4.
Segment 3 recombination event supported by multiple isolates. (A) Phylogenetic trees made using alignments from (left) nucleotide positions 1-1259 and 1800-2213 representing the major parent region excluding second recombination event (Fig. 5), and (right) nucleotide position 2214-2617 representing the minor parent sequence. (B) BootScan (top) and RDP (bottom) analyses. The red line compares the minor parent to the recombinant, blue line compares the major parent to the recombinant, and the green line compares the major parent to the minor parent. The Y-axis for the BootScan analysis (top) is the bootstrap support, while the Y-axis for the RDP analysis (bottom) is the pairwise identity. The X-axis for both analyses is the sequence along segment 3.

