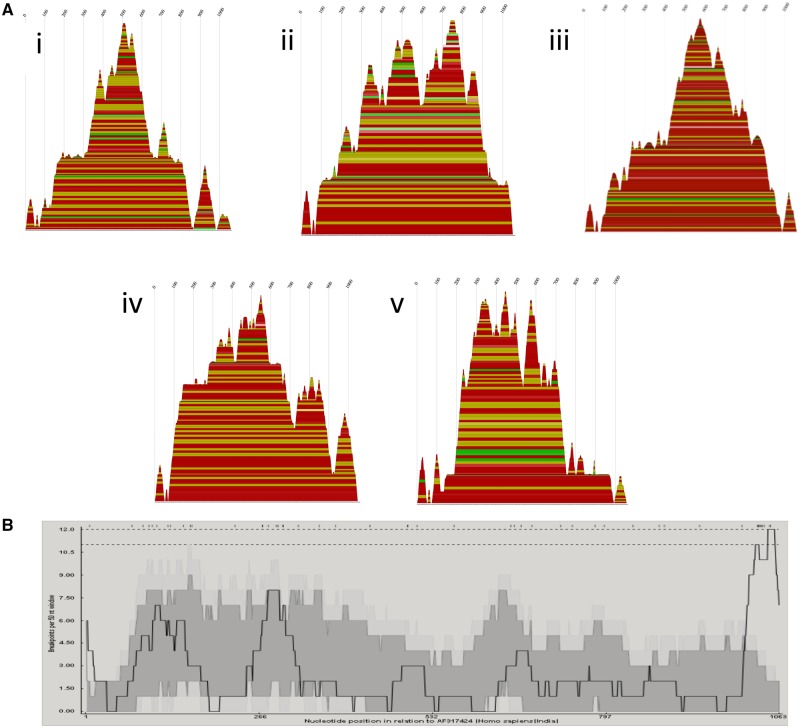
Figure 7.
(A) Consensus mountain plots made in RNAalifold using the ViennaRNA package of the predicted RNA secondary structures based on alignments made using full sequences for each of the five segment 9G types involved in the intergenotypic recombination events: (1) G9, (2) G6, (3) G3, (4) G1, and (5) G2. Peaks represent hairpin loops, slopes correspond to helices, and plateaus correspond to loops. The X-axis corresponds to the sequence of the segment. Each base-pairing is represented by a horizontal box where the height of the box corresponds with the thermodynamic likelihood of the pairing. The colors correspond to the variation of base pairings at that position. Red indicates the base pairs are highly conserved across all the sequences, and black indicates the least conservation of those base pairings. (B) Breakpoint distribution plots made in RDP4 of putative recombinants in segment 9. The X-axis shows the position in the sequence, and Y-axis shows the number of breakpoints per 50-nucleotide window. The highest peaks are around X = 115, 285, 1,050.

