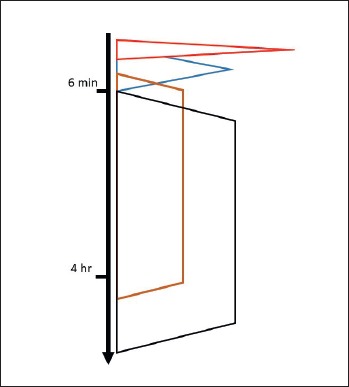
Figure 3.

Schematic representation of the cellular energy handling versus time of exercise. From the top red: free ATP and phosphocreatine/creatine system, blue: anaerobic glycolysis (muscular glycogen), brown: aerobic oxidation (muscular glycogen, plasma glucose, liver glycogen), black: aerobic oxidation (adipose tissue triglycerides, plasma free fatty acids).
