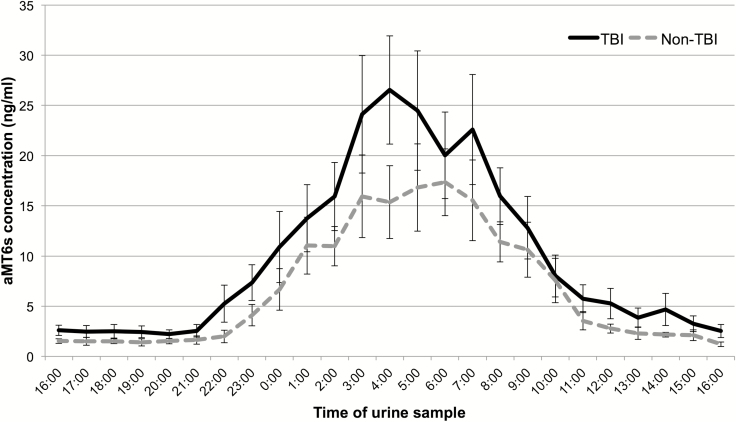
Figure 1.
Average 24-hour melatonin profiles of the TBI and non-TBI groups. Average 24-hour profiles of urinary concentration of aMT6s for the TBI (solid line) and non-TBI (dashed line) groups. Data points represent the hourly concentrations of aMT6s (ng/mL), accumulated in the hour prior to the urine collection time reported on the x-axis. Error bars represent SE.

