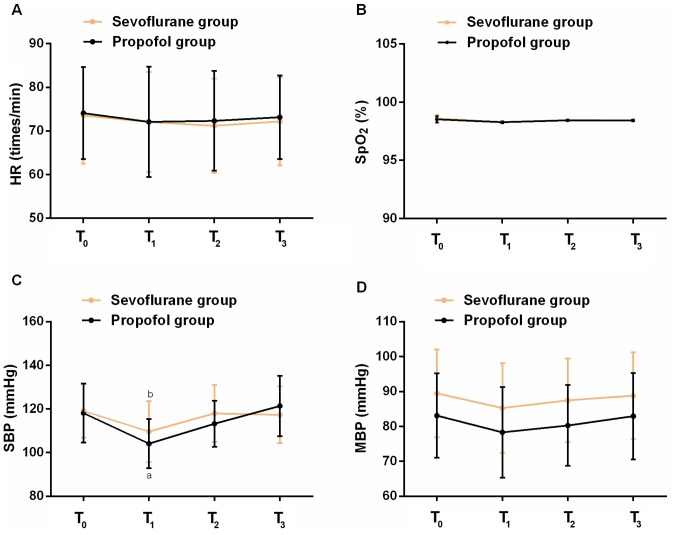
Figure 2.
Comparison of the hemodynamic indicators of the patients in the two groups. Comparison of (A) HR, (B) SpO2, (C) SBP and (D) MBP in the propofol and sevoflurane group. aP<0.05, compared with the propofol group at 0 min; bP<0.05, compared with the sevoflurane group at 0 min. HR, heart rate; SpO2, oxygen saturation; SBP, systolic blood pressure; MBP, mean blood pressure.

