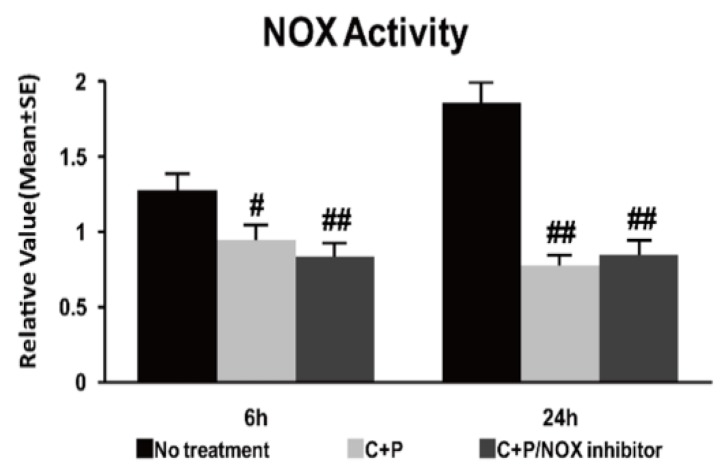
Figure 3.
NOX activity luminescence assay in control treatment, C+P treatment, and C+P/NOX inhibitor treatment cohorts. C+P treatment and C+P/NOX inhibitor treatment both produced decreased NOX activity (mean ± SE) at both 6 and 24 h, though there was no significant difference between treatment cohorts at 6 or 24 h of reperfusion. NOX activity at 6 h: no treatment 1.3 ± 0.1, C+P 1.0 ± 0.1, C+P/NOX inhibitor 0.8 ± 0.1; NOX activity at 24 h: no treatment 1.9 ± 0.1, C+P 0.8 ± 0.1, C+P/NOX inhibitor 0.8 ± 0.1 (# p < 0.05, ## p < 0.01).

