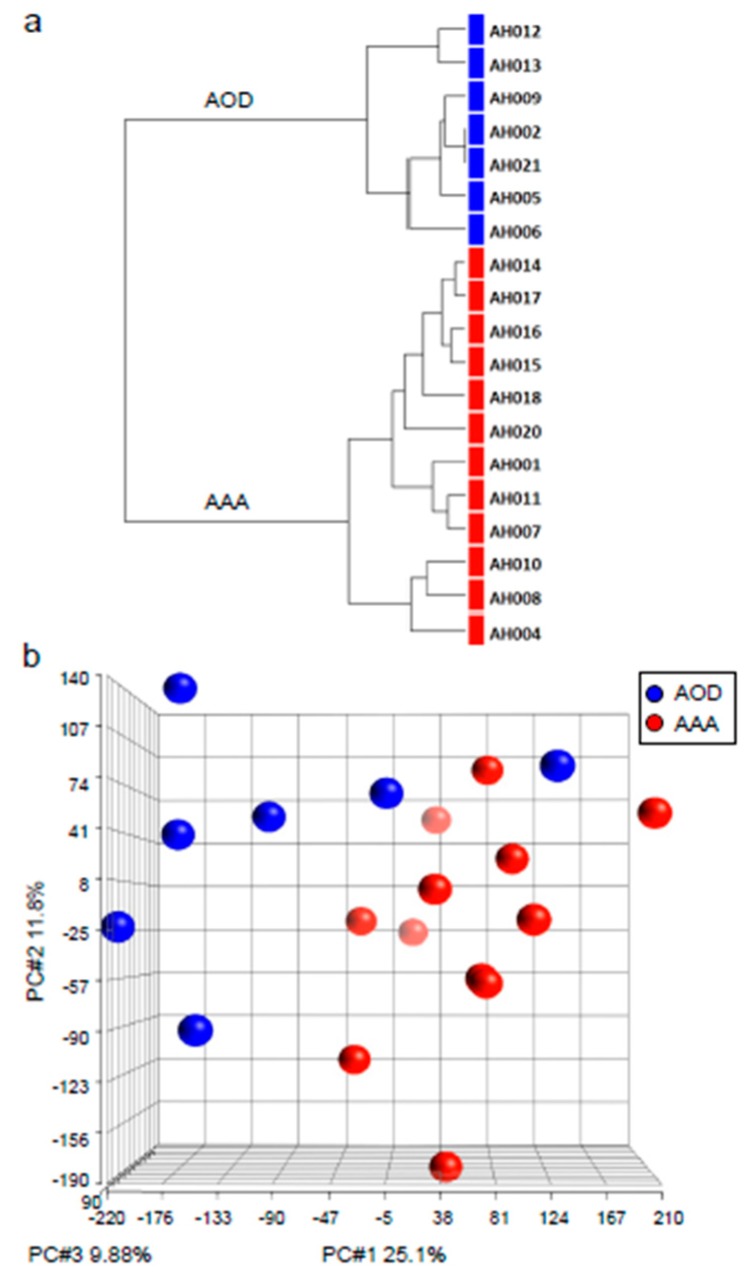
Figure 1.
(a) Hierarchical clustering dendrogram of AAA (adominal aortic aneurysm) and AOD (arterial occlusive disease) samples. (b) Principal component analysis lot of AAA and AOD samples. In red the AAA patient samples, in blue the AOD patient samples. On the x, y, and z axis: PC#1 25.1%, PC#2 11.8%, PC#3 9.88%, respectively.

