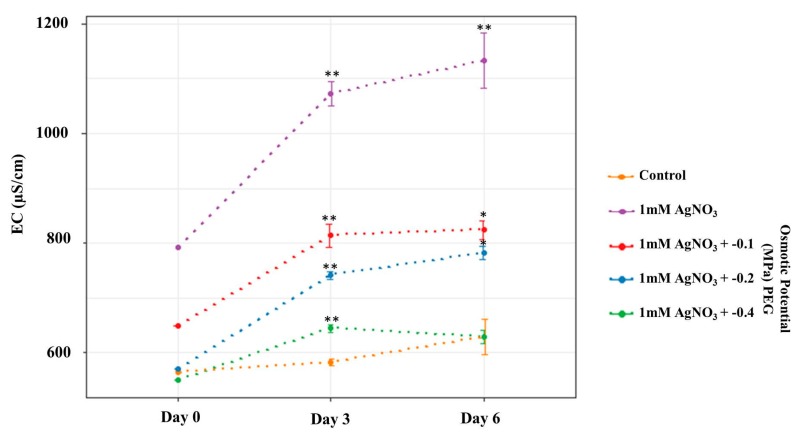
Figure 2.
Electrical conductivity of the control and the treated plant media. The figure represents the EC values of the prepared solution on day 0, and the average electrical conductivity (EC) on days 3 and 6 respectively. This figure was created using R [25].

