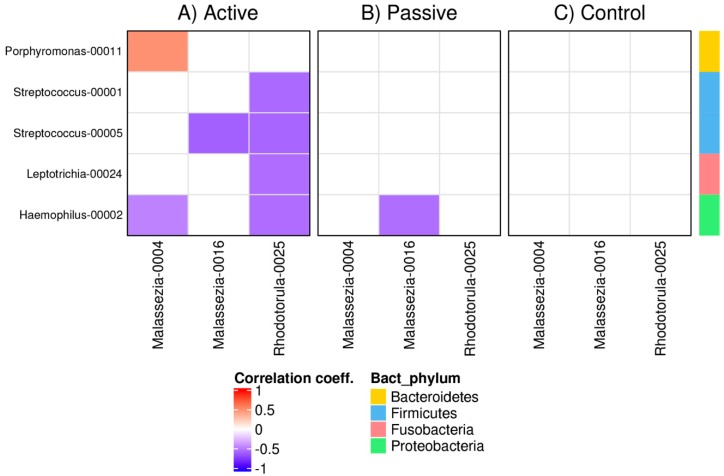
Figure 3.
Correlation networks between bacterial and fungal OTUs in RAS patients compared with healthy controls. Correlation pattern between bacterial and fungal OTUs in (A) Active, (B) Passive, and (C) Control cohort. Blue squares indicate inverse correlations (negative values) and red squares indicate positive correlations (positive values) in proportions of reads between individual OTUs. Color intensity shows the magnitude of the association; the darker the color, the stronger the association. Correlations that did not deviate from zero (p < 0.05) are indicated by white color. Statistical significance is based on Markov Chain Monte Carlo sampling.

