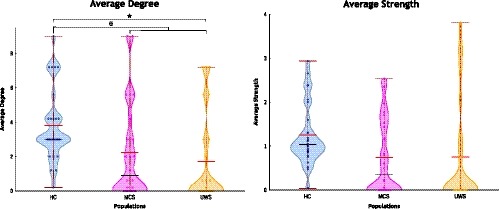
Figure 3.

Distribution of the average integration measurements for the three populations herein studied. (a) Degree and (b) Strength. Red lines indicate the mean, black lines indicate the median and red wine lines indicate the maximum. Each dot in the violin represents the measurement on a single subject. ✶ aims for a significant difference between healthy controls (HC) and minimally conscious state (MCS; p < .05). ★ aims for a significant difference between HC and unresponsive wakefulness syndrome (UWS; p < .05). ✠ aims for a significant difference between HC and patients with disorders of consciousness p < .05)
