
Figure 4.
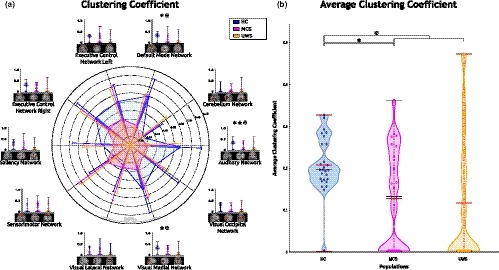
Segregation measurement between resting state networks by clustering coefficient. (a) fingerprint (b) violin plot. Higher clustering coefficient values were observed for healthy controls (HC) than for subjects with disorders of consciousness (DOC) except by sensorimotor network. ✶ aims for a significant difference between HC and patients with minimally conscious state (MCS). ★ aims for a significant difference between HC and unresponsive wakefulness syndrome (UWS). ✠ aims for a significant difference between HC and patients with DOC