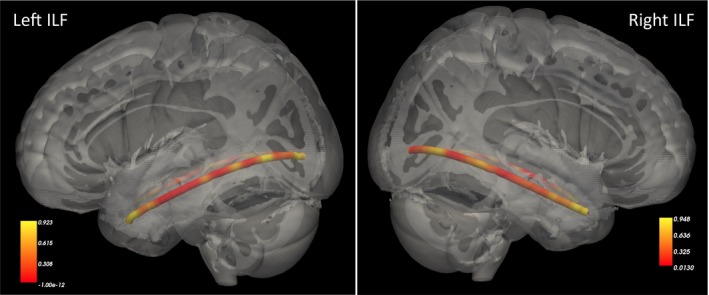
Figure 4.

Heat maps illustrating p‐values for the association between total childhood maltreatment (Childhood Trauma Questionnaire total score) and fractional anisotropy along the trajectory of the inferior longitudinal fasciculus

Heat maps illustrating p‐values for the association between total childhood maltreatment (Childhood Trauma Questionnaire total score) and fractional anisotropy along the trajectory of the inferior longitudinal fasciculus