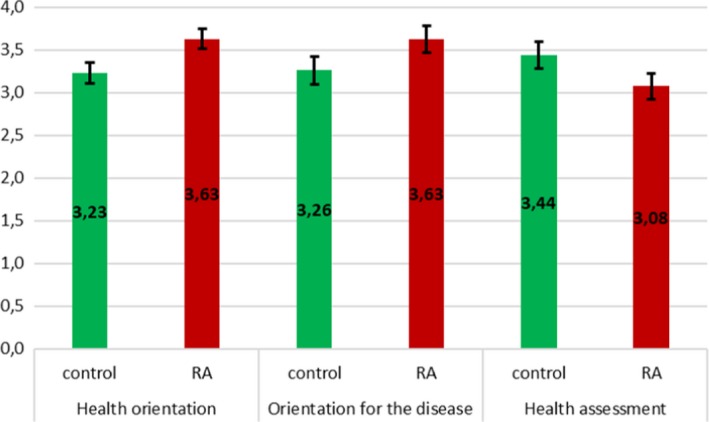
Figure 4.

Profiles of health orientation, orientation for the disease, and health assessment in the control group and the RA groups with 95% confidence intervals computed with the use of Bonferroni correction

Profiles of health orientation, orientation for the disease, and health assessment in the control group and the RA groups with 95% confidence intervals computed with the use of Bonferroni correction