Figure 4.
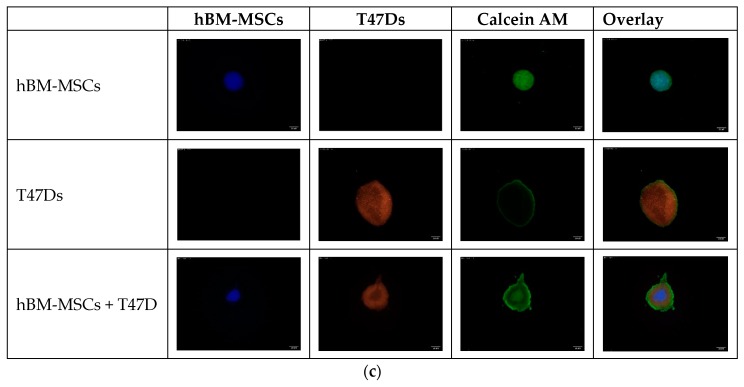
(a) Change in spheroid size of heterotypic hBM-MSCs + cancer cell spheroids and homotypic hBM-MSC spheroids across a period of 5 days. Significance depicted by *. Combining hBM-MSCs with T47D cells led to formation of the smallest hBM-MSCs spheroids, compared to hBM-MSCs with MDA-MB-231, which formed large, less compacted spheroids (p = 0.001). (b) Size of spheroids in co-culture across 5 days as a fraction of starting size on day 0. (c) Representative images of hBM-MSC spheroid size when cultured as spheroids alone, and with T47D cells at a 1:1 ratio. hBM-MSCs formed a small, compact core spheroid in the middle of the T47D + hBM-MSCs spheroid. hBM-MSCs and T47Ds were fluorescently stained with CellTracker™ dyes Deep Red (blue filter applied on ImageJ) and Orange CMRA, respectively. Images taken at 4× magnification; scale bar is 250 µM.


