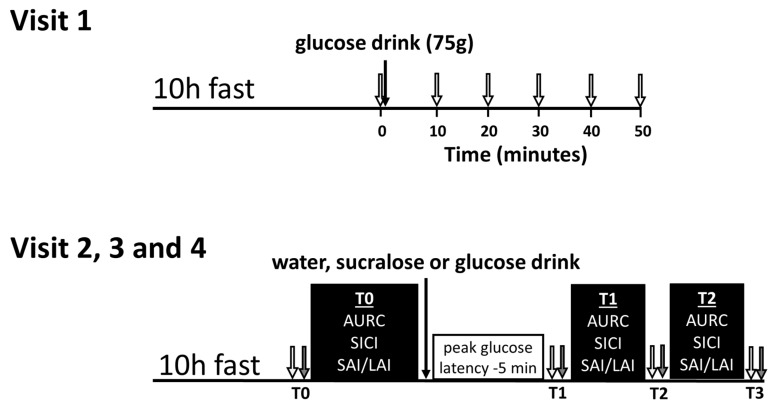
Figure 1.
Timeline for the preliminary visit (visit 1) and the three experimental visits (visits 2, 3 and 4). For visit 1, baseline blood glucose was measured (0 min) and then participants drank 75 g of glucose. Next, blood glucose was measured every 10 min for 50 min or until peak was observed (open arrows). For visits 2, 3 and 4, the transcranial magnetic stimulation (TMS) testing bouts (black boxes) at T0 and T1 were separated by a rest period equal to the glucose latency minus 5 min. Mean arterial pressure (grey arrows) and blood glucose (open arrows) were measured before, after and in between the TMS testing bouts and are labeled T0, T1, T2 and T3. TMS—transcranial magnetic stimulation; AURC—area under the recruitment curve; SICI—short-interval intracortical inhibition; SAI/LAI—short-latency afferent inhibition/long-latency afferent inhibition.

