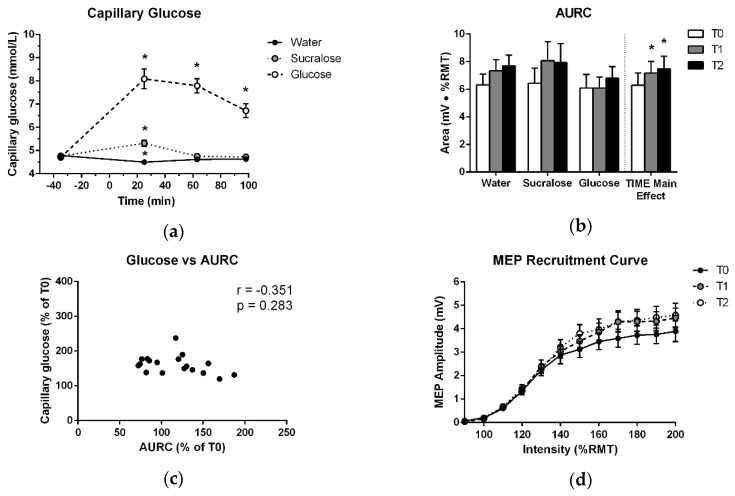
Figure 2.
(a) Mean and standard error of capillary blood glucose levels over the course of each testing session. Measurements are plotted at each timepoint before and after ingestion of glucose, sucralose or water, which were consumed at 0 min. (b) Means and standard errors of AURC data entered into the ANOVA and treatment-averaged data, showing the significant effect of TIME. (c) Average relative increase in plasma glucose across T1, T2 and T3, plotted against the average relative increase in AURC across T1 and T2. (d) Treatment-averaged motor-evoked potentials (MEP) responses with mean and standard error at each TMS intensity of the recruitment curve for T0, T1 and T2. * indicates a significant difference from T0 (p < 0.05).

