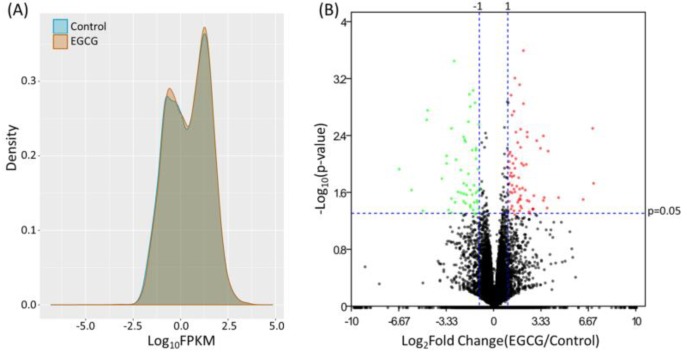
Figure 1.
Differential gene expression patterns of BFTC-905 cells, human urinary bladder transitional cell carcinoma (TCC) cell line, treated with epigallocatechin gallate (EGCG) or water (control). (A) The density plot showing the frequency distribution of fragments per kilobase of transcript per million mapped reads (FPKM) in bladder TCC cells treated with EGCG or water (control). (B) The volcano plot showing the differentially expressed genes in bladder TCC cells treated with EGCG or water (control). Genes significantly up-regulated in EGCG-treated bladder TCC cells were plotted in red, and genes significantly down-regulated were plotted in green. Genes with fold-changes >2.0 and p-value < 0.05 were considered significantly dysregulated.

