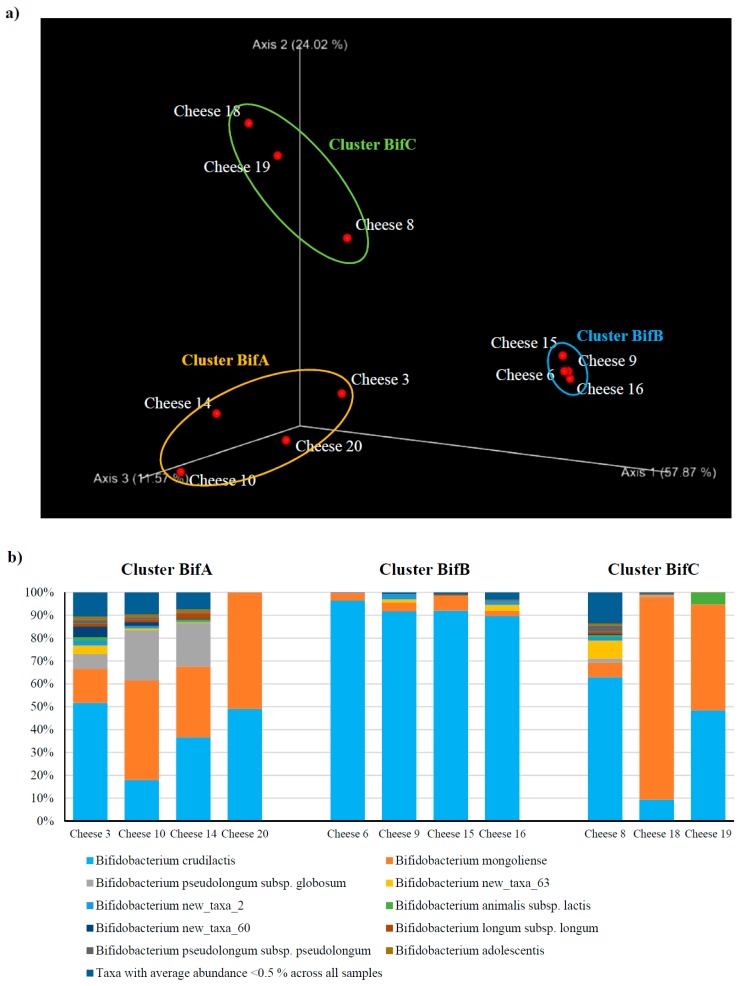
Figure 2.
Taxonomic dissection of the bifidobacterial population harbored by raw cheese. (a) shows a PCoA representation of the beta-diversity analysis performed for bifidobacterial ITS data at species level using the Bray–Curtis index. (b) displays a bar plot representation of the bifidobacterial population at the species level observed in 11 ‘raw’ cheese samples (i.e., those for which we could obtain data). Only taxa with an average abundance >0.5% are shown.

