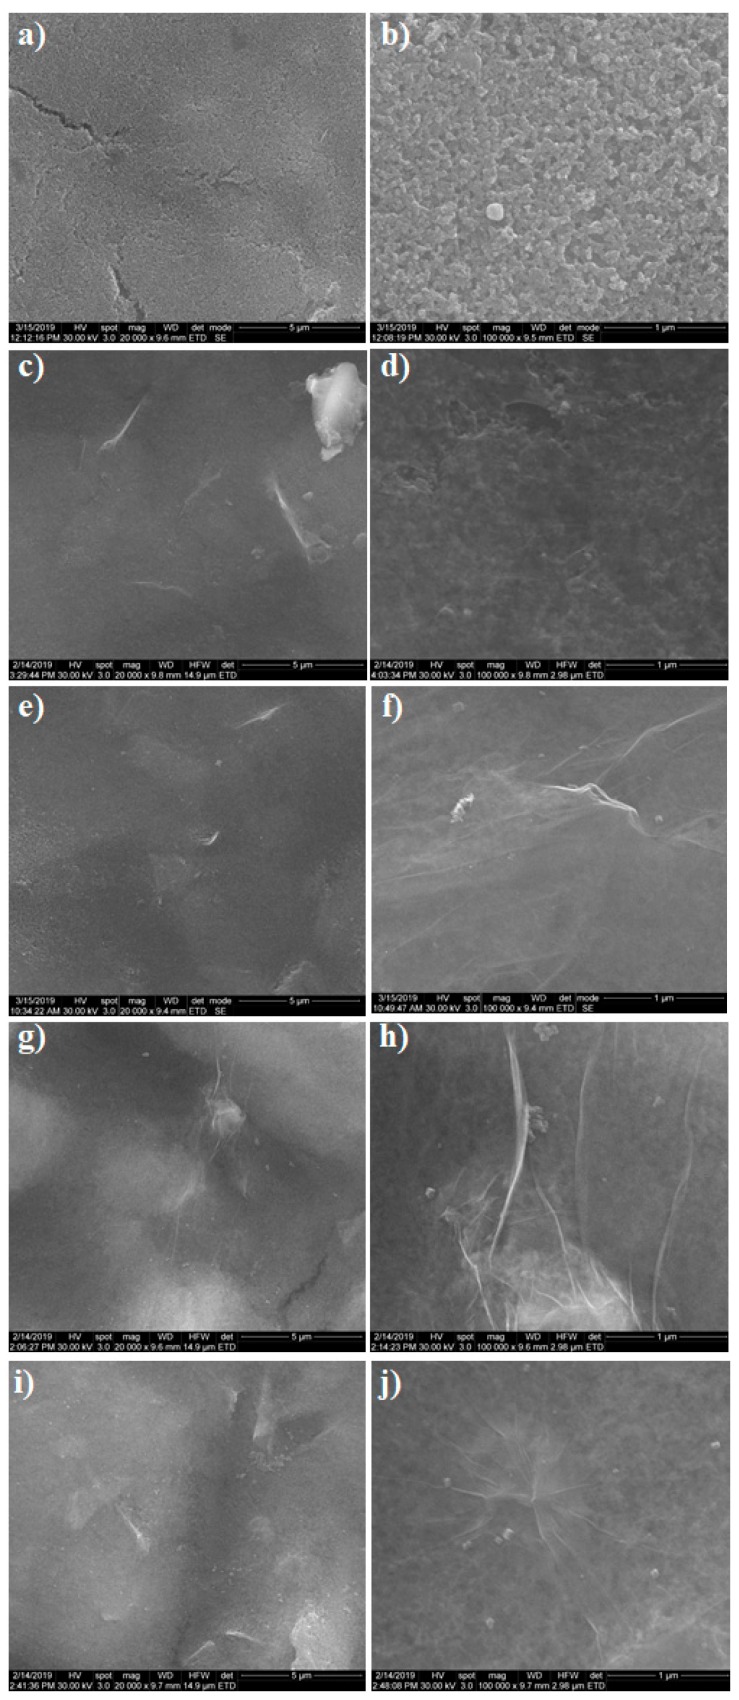
Figure 1.
(a,b) SEM images of bare screen printed carbon electrode (SPCE). (c-j) SEM images of graphene oxide (GO) deposited on SPCE using different dispersion concentrations: (c,d) 0.05 mg/mL; (e,f) 0.1 mg/mL; (g,h) 0.15 mg/mL; and (i,j) 0.2 mg/mL. (a,c,e,g,i) Images recorded at 20 kX magnification. (b,d,f,h,j) Images recorded at 100 kX magnification.

