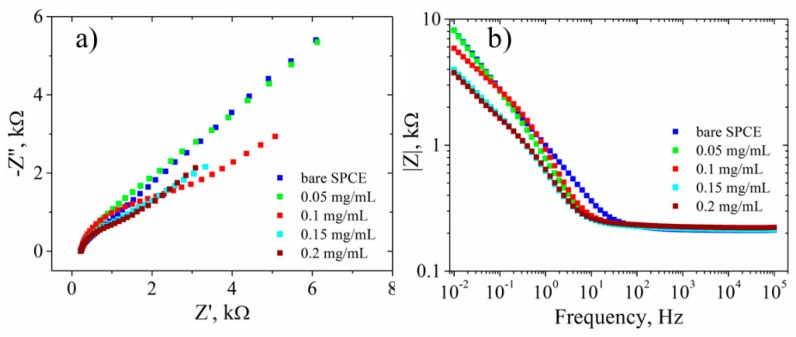
Figure 9.
EIS characterization: (a) Nyquist plot; (b) EIS Bode plot—impedance modulus. Characterizations were recorded in 1 mM [Fe(CN)6]3−/4−, 0.1 M KCl, for bare SPCE (blue) and RGO-SPCEs obtained using different concentrations of GO dispersions 0.05 mg/mL (green), 0.1 mg/mL (red), 0.15 mg/mL (cyan), and 0.2 mg/mL (dark red).

