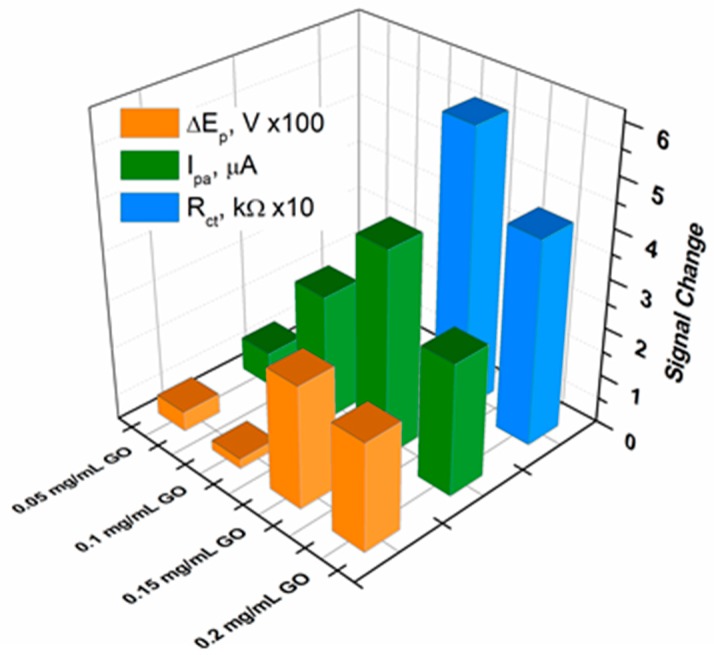
Figure 13.
Signal change in peak current intensities (Ipa), peak-to-peak separation potentials (ΔEp) and charge transfer resistance values obtained from EIS measurements (Rct, quality of fitting χ2 = 0.051 ± 0.022) after hybridization with 100 nM DNA target in respect with the measured values after ssDNA probe adsorption.

