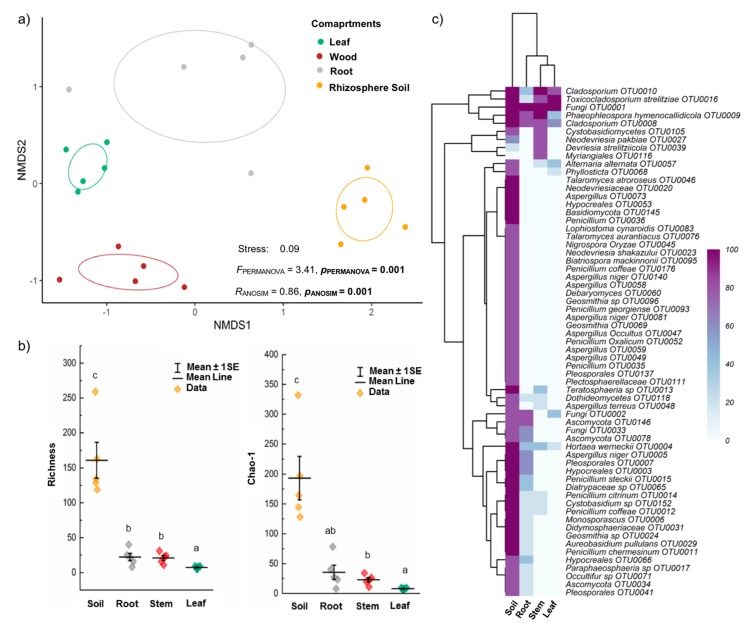
Figure 5.
Fungal community composition and richness across the R. stylosa (rhizosphere soil and plant compartments: (a) non-metric multidimensional scaling plot of fungal communities in indicated compartments, showing 95% confidence ellipses around mean values of NMDS axes 1 and 2; (b) fungal OTU and Chao1-estimated OTU richness (means ± SE), and (c) heatmap of dominant fungal OTUs based on percent occurrence data (accounting for ≥ 80% of OTUs in at least one compartment). Different letters above OTU/Chao1 richness bars within a panel indicate significant differences (p < 0.05) according to analysis of variance or Kruskal-Wallis tests.

