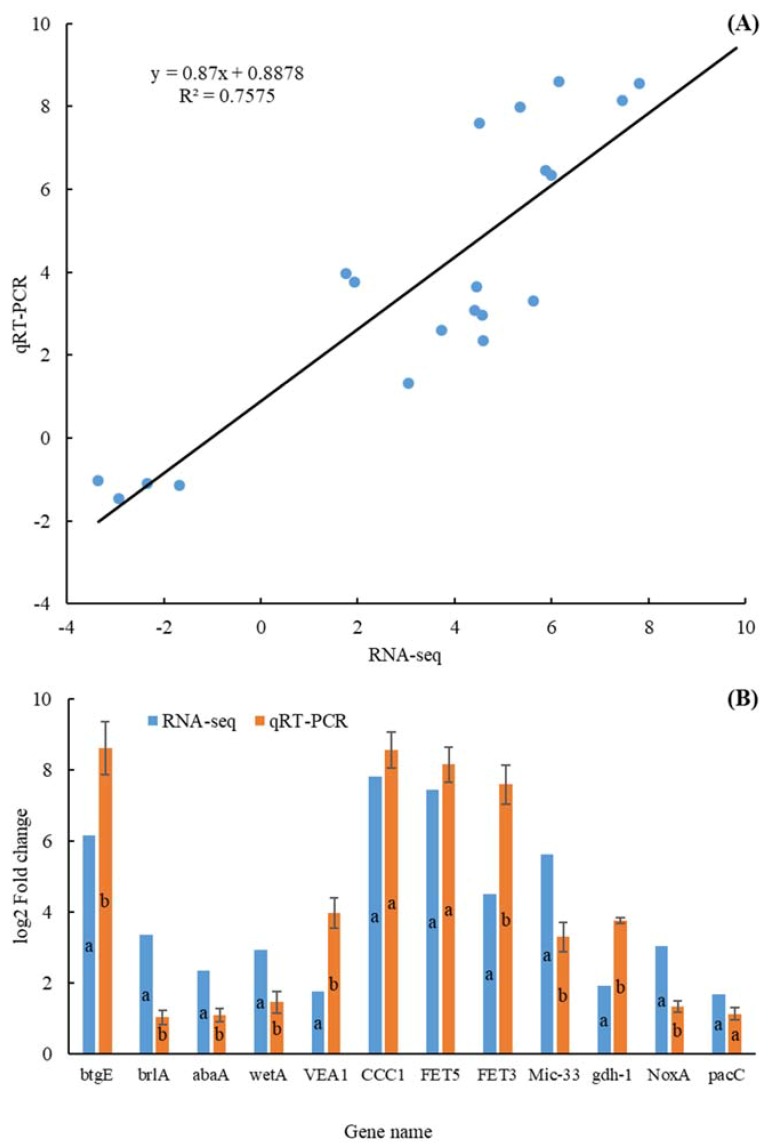
Figure 2.
The comparison of gene expression values obtained by qRT-PCR and RNA-seq. qRT-PCR: The gene expression log2(Fold Change) value of 20 differentially expressed genes (DEGs) in qRT-PCR analysis; RNA-seq: The gene expression log2(Fold Change) value of DEGs in RNA-seq analysis; (A): linear relationship; (B): numerical comparison; Data in columns with the different letters are significantly different according to Duncan’s multiple range test at p < 0.05.

