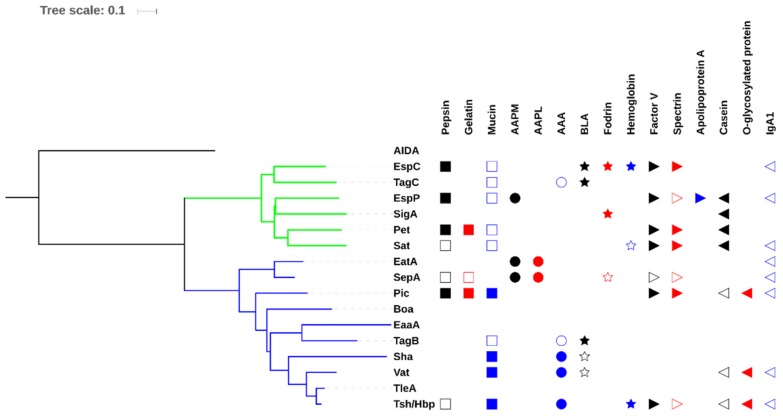
Figure 4.
Evolutionary relationships of SPATEs based on passenger domain sequences and presentation of known protease substrates. The evolutionary history of passenger domains of characterized SPATEs was inferred using the neighbor-joining method [48]. The tree is drawn to scale, with branch lengths in the same units as those of the evolutionary distances used to infer the phylogenetic tree. The evolutionary distances were computed using the JTT matrix-based method [49] and are in the units of the number of amino acid substitutions per site. The analysis involved 17 protein sequences. All positions containing gaps and missing data were eliminated. Evolutionary analyses were conducted in MEGA6 [50]. Multiple sequence alignment was performed by Clustal W and the tree was constructed using the Mega6 software with PhyML/bootstrapping and iTOL [51]. Cluster of cytotoxic SPATEs (class 1) are in green branches while immunomodulator SPATEs (class 2) are in blue branches. SPATE protein sequences are available in NCBI database as follows: EspC, GenBank Accession No. AAC44731; EspP, NP_052685; SigA, AF200692; Pet, SJK83553; Sat, AAG30168; EatA, CAI79539, SepA, Z48219; Sha, MH899684; Pic, ALT57188; Boa, AAW66606; TagB and TagC, MH899681; EaaA, AAF63237; Vat, AY151282; TleA, KF494347; Tsh/Hbp, AF218073; AIDA, ABS20376; AAPM: MeOSuc-Ala-Ala-Pro-Met-pNA, AAPL: Suc-Ala-Ala-Pro-Leu-pNA, AAA: N-Succinyl-Ala-Ala-Ala-p-nitroanilide, BLA: N-Benzoyl-L-arginine 4-nitroanilide. The cleaved substrates, substrates that were negative for cleavage, and those untested substrates are represented by filled symbol, unfilled symbol and no symbol respectively. This comparison shows that some of the activities are phylogenetically distributed.

