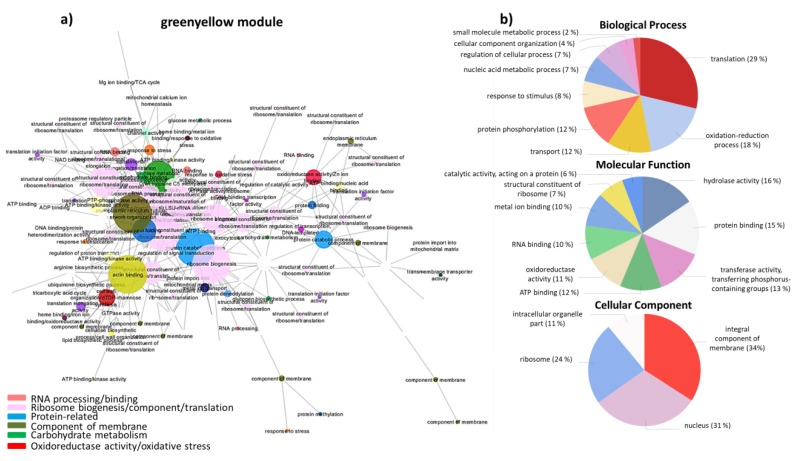
Figure 3.
(a) Network visualization of interactions between wheat genes in the “greenyellow” module, related to O. compressus. Larger nodes correspond to hub genes. (b) Pie-charts of GO terms distribution of genes in the “greenyellow” module belonging to the Biological Process, Molecular Function and Cellular Component classes.

