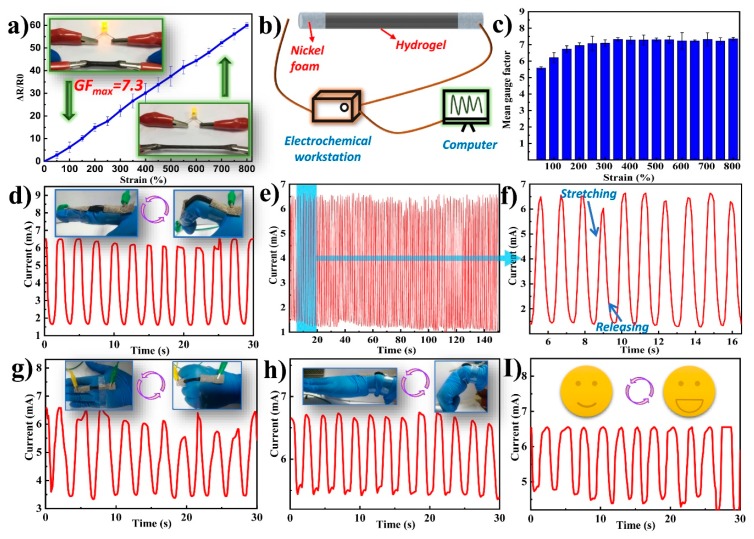
Figure 7.
(a) Plot of relative variation in resistance as a function of applied strains for TOCNF/PAA-PPy-0.6 hydrogels. (b) Schematic diagram of the assembly of the hydrogel-based sensor. Electric current response of the strain sensor for monitoring. (c) Calculated mean gauge factors of the TONCF/PAA-PPy sensors under different strains between 100 and 800%. (d) Finger bending. (e) Real-time I–t curves measured by cyclic finger stretching/releasing at 5 V within 150 s for repeatability tests. (f) Zoomed-in version of the plot Figure 7e from 5–20 s. (g) Fist clenching. (h) Wrist bending. (i) Mouth opening activity at the cheek.

