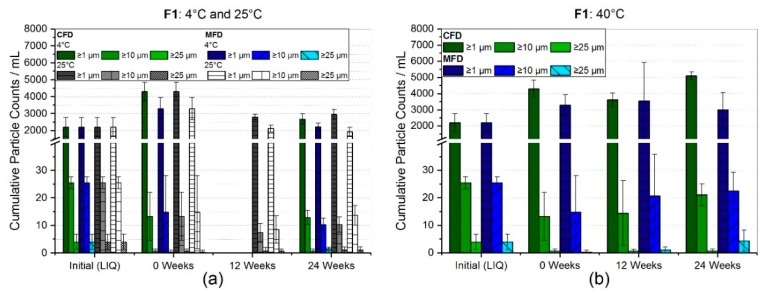
Figure 3.
Subvisible particle (SvP) counts for formulation F1 measured by light obscuration and size-exclusion chromatography results. The bar charts represent the subvisible particle counts for the respective storage temperatures (a) 4 °C, 25 °C, and (b) 40 °C. Bars represent the mean value ± standard deviation for three individual vials.

