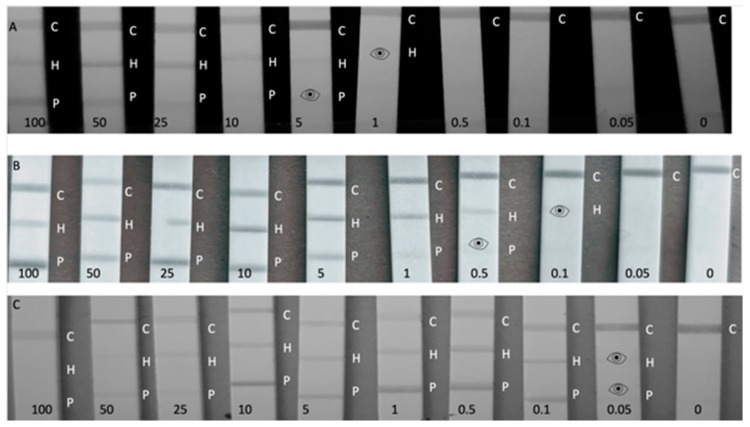
Figure 3.
Calibration range (100–0.05 ppm) of Total Hazelnut Protein (THP), Total Peanut Protein (TPP) spiked into Running Buffer (RB) and blank RB, where the control line is indicated by C, the hazelnut test line by an H and the peanut test line by a P. A positive result can be still read with the naked eye, but is difficult to see in the smartphone image, thus an eye icon has been used to indicate the visual LOD. (A) Peanut, Hazelnut, Control (PHC) line configuration using 1 µL of spiked sample and 99 µL RB. (B) PHC using 25 µL of spiked sample and 75 µL RB. (C) PHC using 75 µL of spiked sample and 25 µL RB.

