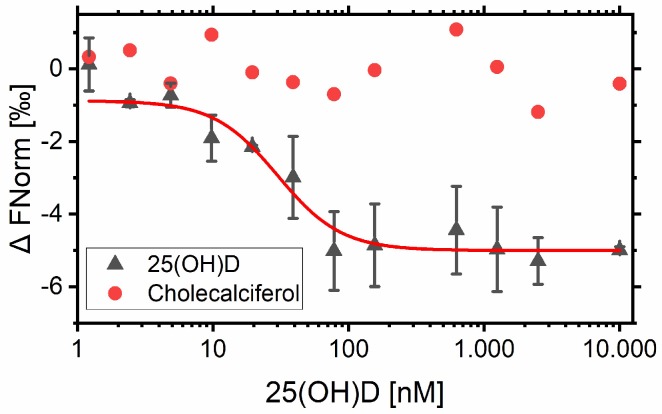
Figure 4.
Aptamer VDBA14 binding to 25(OH)D and cholecalciferol. Binding curves were generated by NT.Analysis Software and edited in Origin. The aptamer concentration was kept constant at 10 nM, while the concentration of 25(OH)D and cholecalciferol varied from 1 nM to 10 μM. Microscale thermophoresis (MST) experiments were carried out at 35 °C. Error bars represent the standard deviation of three individual MST experiments (N = 3).

