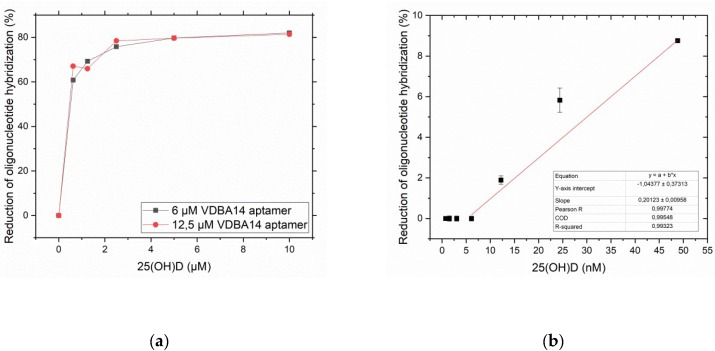
Figure 7.
(a) Reduction of oligonucleotide 3 hybridization depending on the 25(OH)D concentration at two different aptamer densities (6 µM and 12.5 µM). (b) Reduction of oligonucleotide 3 hybridization depending on the 25(OH)D concentration range (between 0 and 50 nM). Error bars represent the standard deviation of three individual experiments (N = 3).

