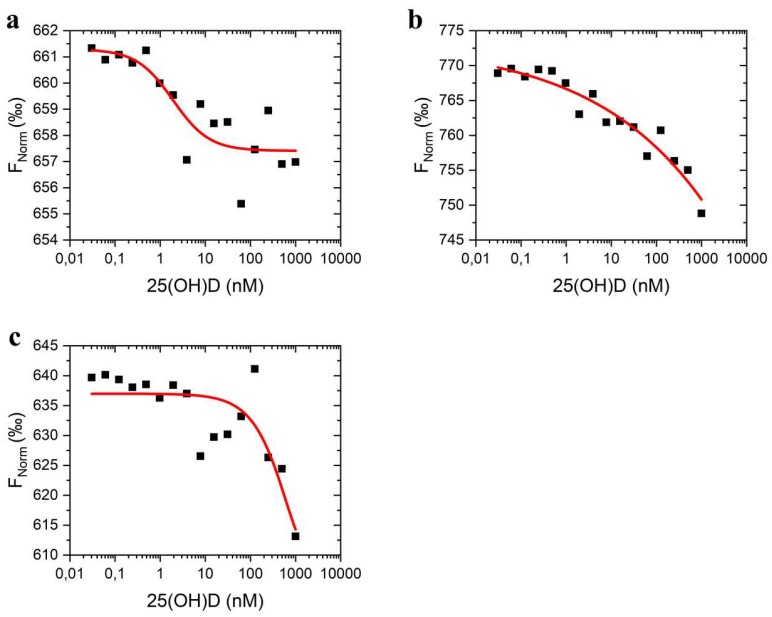
Figure A1.
Oligonucleotides 1 (a), 2 (b), and 3 (c) binding to the VDBA14 aptamer at different 25(OH)D concentrations. Binding curves were generated by NT.Analysis Software and edited in Origin. The aptamer and oligonucleotide concentrations were kept constant at 50 nM, while the 25(OH)D concentration varied between 1 µM and 0.01 nM.

