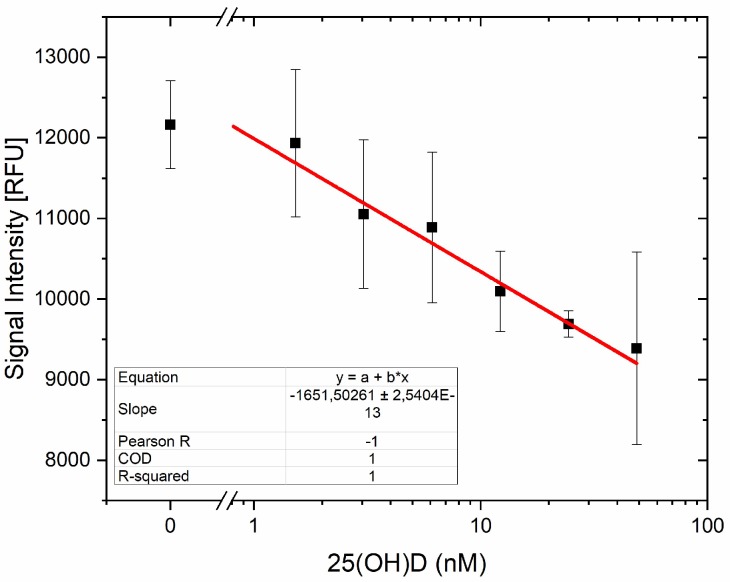
Figure A2.
Influence of the 25(OH)D concentration on the signal intensity (relative fluorescence units (RFUs)), which was influenced by the displacement of the complementary oligonucleotide 3. The 25(OH)D concentration varied between 0 and 50 nM. The resulting data were then fitted using a linear equation in Origin. The limit of detection (LOD)/limit of quantification (LOQ) were calculated based on the sensitivity (S) of the method, here determined as the slope of the shown curve. See Section 2.5 for the equation. Error bars represent the standard deviation of three individual experiments (N = 3).

